
Bank management · IT controlling · Practical case
IT cost controlling in banks: allocating costs, explaining variances
The half-year report is within budget. The annual forecast nevertheless shows an additional requirement of EUR 75,000. A fully worked case shows how IT managers and controlling find the causes, allocate costs cleanly and prepare decisions.
An expert article by T-NEX. The sample case is entirely fictional; the product description refers to the AI Controlling Hub within the Banking Platform.
The short answer
What does IT cost controlling achieve in a bank?
IT cost controlling connects financial data, service consumption and planning. It explains which IT services cause costs, why actuals and budget diverge, and what total costs are to be expected by the end of the year. To do this, the cost basis, period, allocation and assumptions must fit together. An unremarkable actuals report on its own says little about the requirement still to come.
T-NEX addresses this with the AI Controlling Hub : data import, planning screens and cost allocation models in reports support a shared view. What remains decisive is whether a figure can be traced back to its source and to the allocation rule used. [8]
01 / Clarifying terms
A budget is not a forecast
The statement “We are on plan” remains unclear as long as nobody names the plan. It may mean an approved budget, a revised requirements plan or the current forecast. For management purposes, every view needs a name, a period and a recorded status. The FinOps Foundation therefore treats budgeting and forecasting as related but distinct tasks. [1] [2]
| Cost view | Meaning in this article | Decision question |
|---|---|---|
| Actuals | Management costs recorded for the past period on a defined basis. | What has been incurred so far? |
| Budget | Approved cost framework with a documented original version. | What framework was foreseen? |
| Plan-IT | A separate planning view, for example based on quantities, prices and measures. Its specific definition depends on the organisation. | What requirement do those responsible plan for? |
| Annual forecast | Actuals up to the cut-off date plus the expected costs of the remaining months. | Where are we likely to end up? |
| Obligo | A defined commitment measure. In the case: external purchase commitments for expected costs in the remainder of the year. | Which part of the remaining requirement has already been ordered? |
| Multi-year TCO | Costs over a defined useful life, including the one-off items expressly included. | What does a solution cost over the period under consideration? |
A forecast adjustment does not approve any additional budget. The original budget is retained for comparison. If the framework is formally changed later, that change also needs its own status and a justification.
Payments and income statement expense are further views. A prepaid annual licence may appear on one date in liquidity planning and be spread over several months in an accrual-based cost view. Adding both without checking creates double counting. Which reconciliation applies in a specific institution is agreed by controlling with accounting.
02 / Sample case ITK-2026-01
Balanced in June. EUR 75,000 over in December.
Fictional, limited extract: five cost items for three IT service recipients of a bank. Not the total budget of an average bank and not a customer result. Cut-off date: 30.06.2026. All amounts in euros; uniform modelled management costs. Input VAT deduction, capitalisation and depreciation are not assumed. In a real case, the reconciliation to financial data would have to be documented separately.
The approved annual budget is EUR 540,000. Of this, EUR 300,000 is earmarked for January to June, because the migration project was originally meant to be completed entirely in the first half-year. Exactly EUR 300,000 had been incurred by the end of June. The total looks unremarkable. The individual items tell a different story.
| Cost item | Budget year | Budget H1 | Actuals H1 | Forecast H2 | Forecast year | Variance year |
|---|---|---|---|---|---|---|
| C01 Cloud infrastructure | 120.000 | 60.000 | 72.000 | 84.000 | 156.000 | +36.000 |
| C02 Licences | 96.000 | 48.000 | 48.000 | 48.000 | 96.000 | 0 |
| C03 Internal IT operations | 180.000 | 90.000 | 90.000 | 99.000 | 189.000 | +9.000 |
| C04 External support | 84.000 | 42.000 | 42.000 | 42.000 | 84.000 | 0 |
| C05 Migration | 60.000 | 60.000 | 48.000 | 42.000 | 90.000 | +30.000 |
| Total | 540.000 | 300.000 | 300.000 | 315.000 | 615.000 | +75.000 |
H1 = January to June; H2 = July to December. A positive sign means additional costs compared with the original annual budget. Annual forecast = actuals H1 + forecast H2. Own model calculation; complete inputs and allocations are available under Working materials.
For the cloud, EUR 12,000 more had already been incurred in the half-year. At the same time, EUR 12,000 less was recorded for the migration. The project is, however, delayed, not cheaper. The two variances cancel each other out in the total. For the rest of the year, EUR 315,000 is still needed, although only EUR 240,000 of the original budget remains.
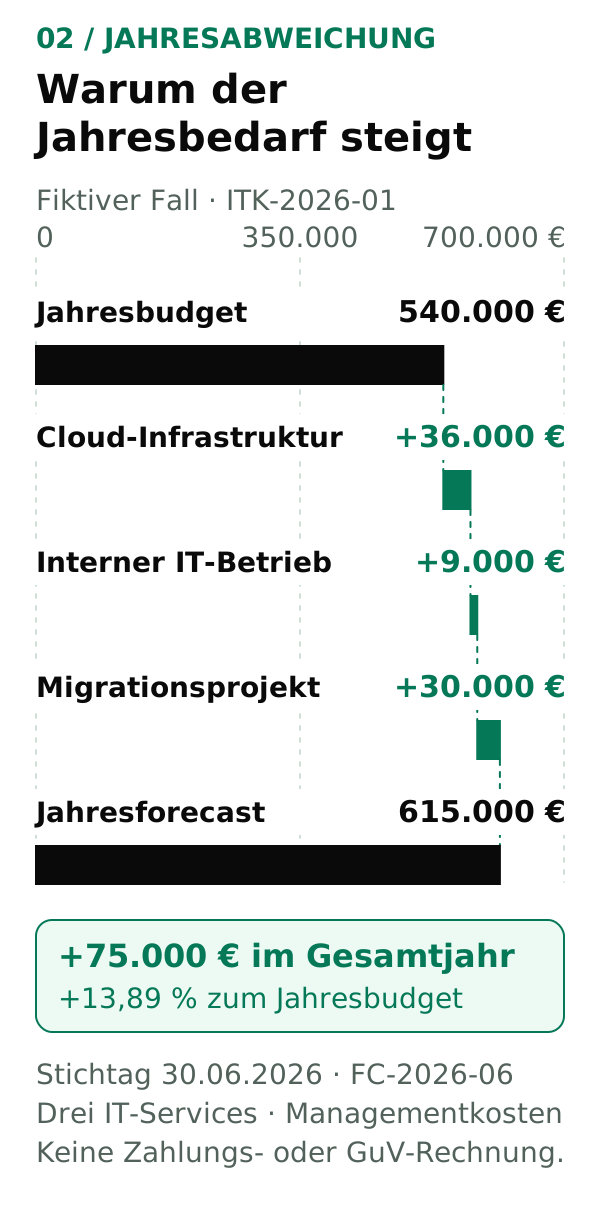
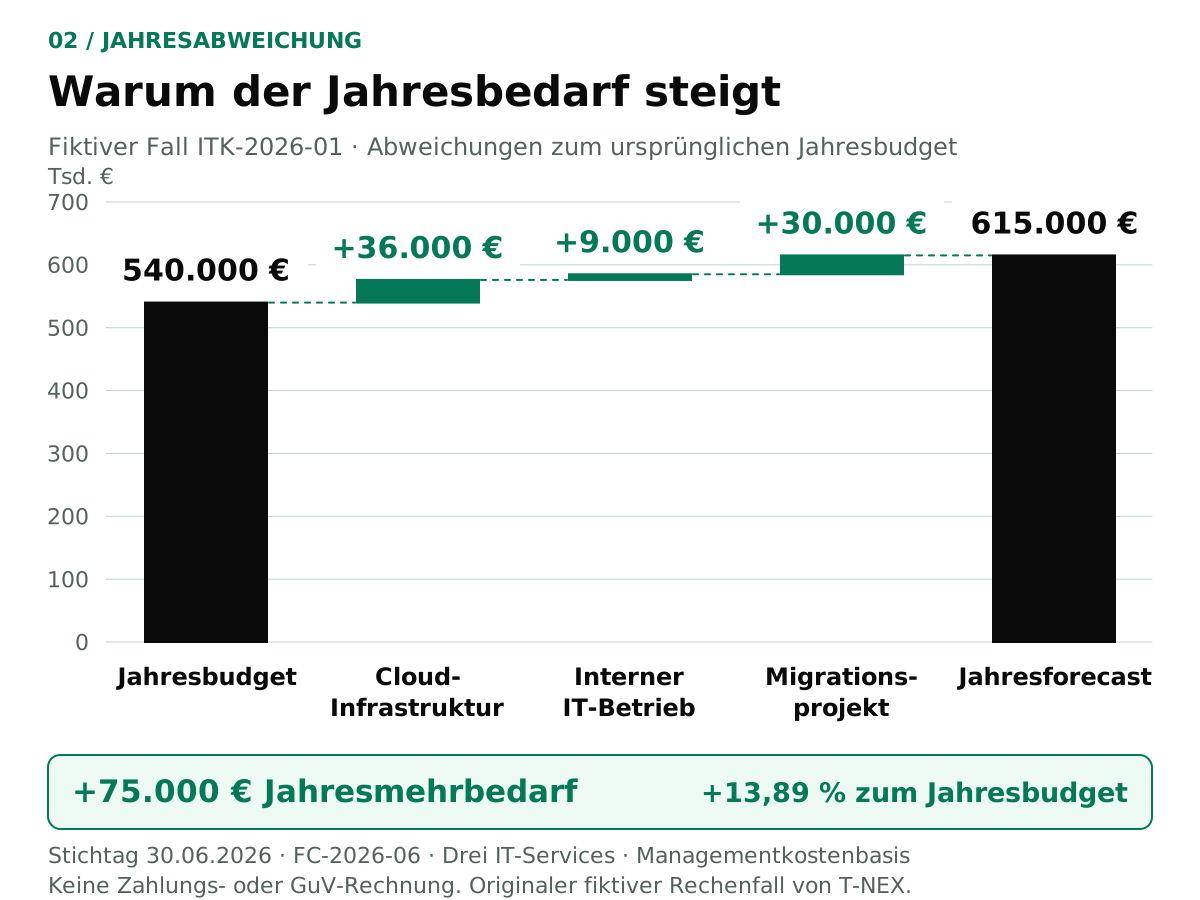
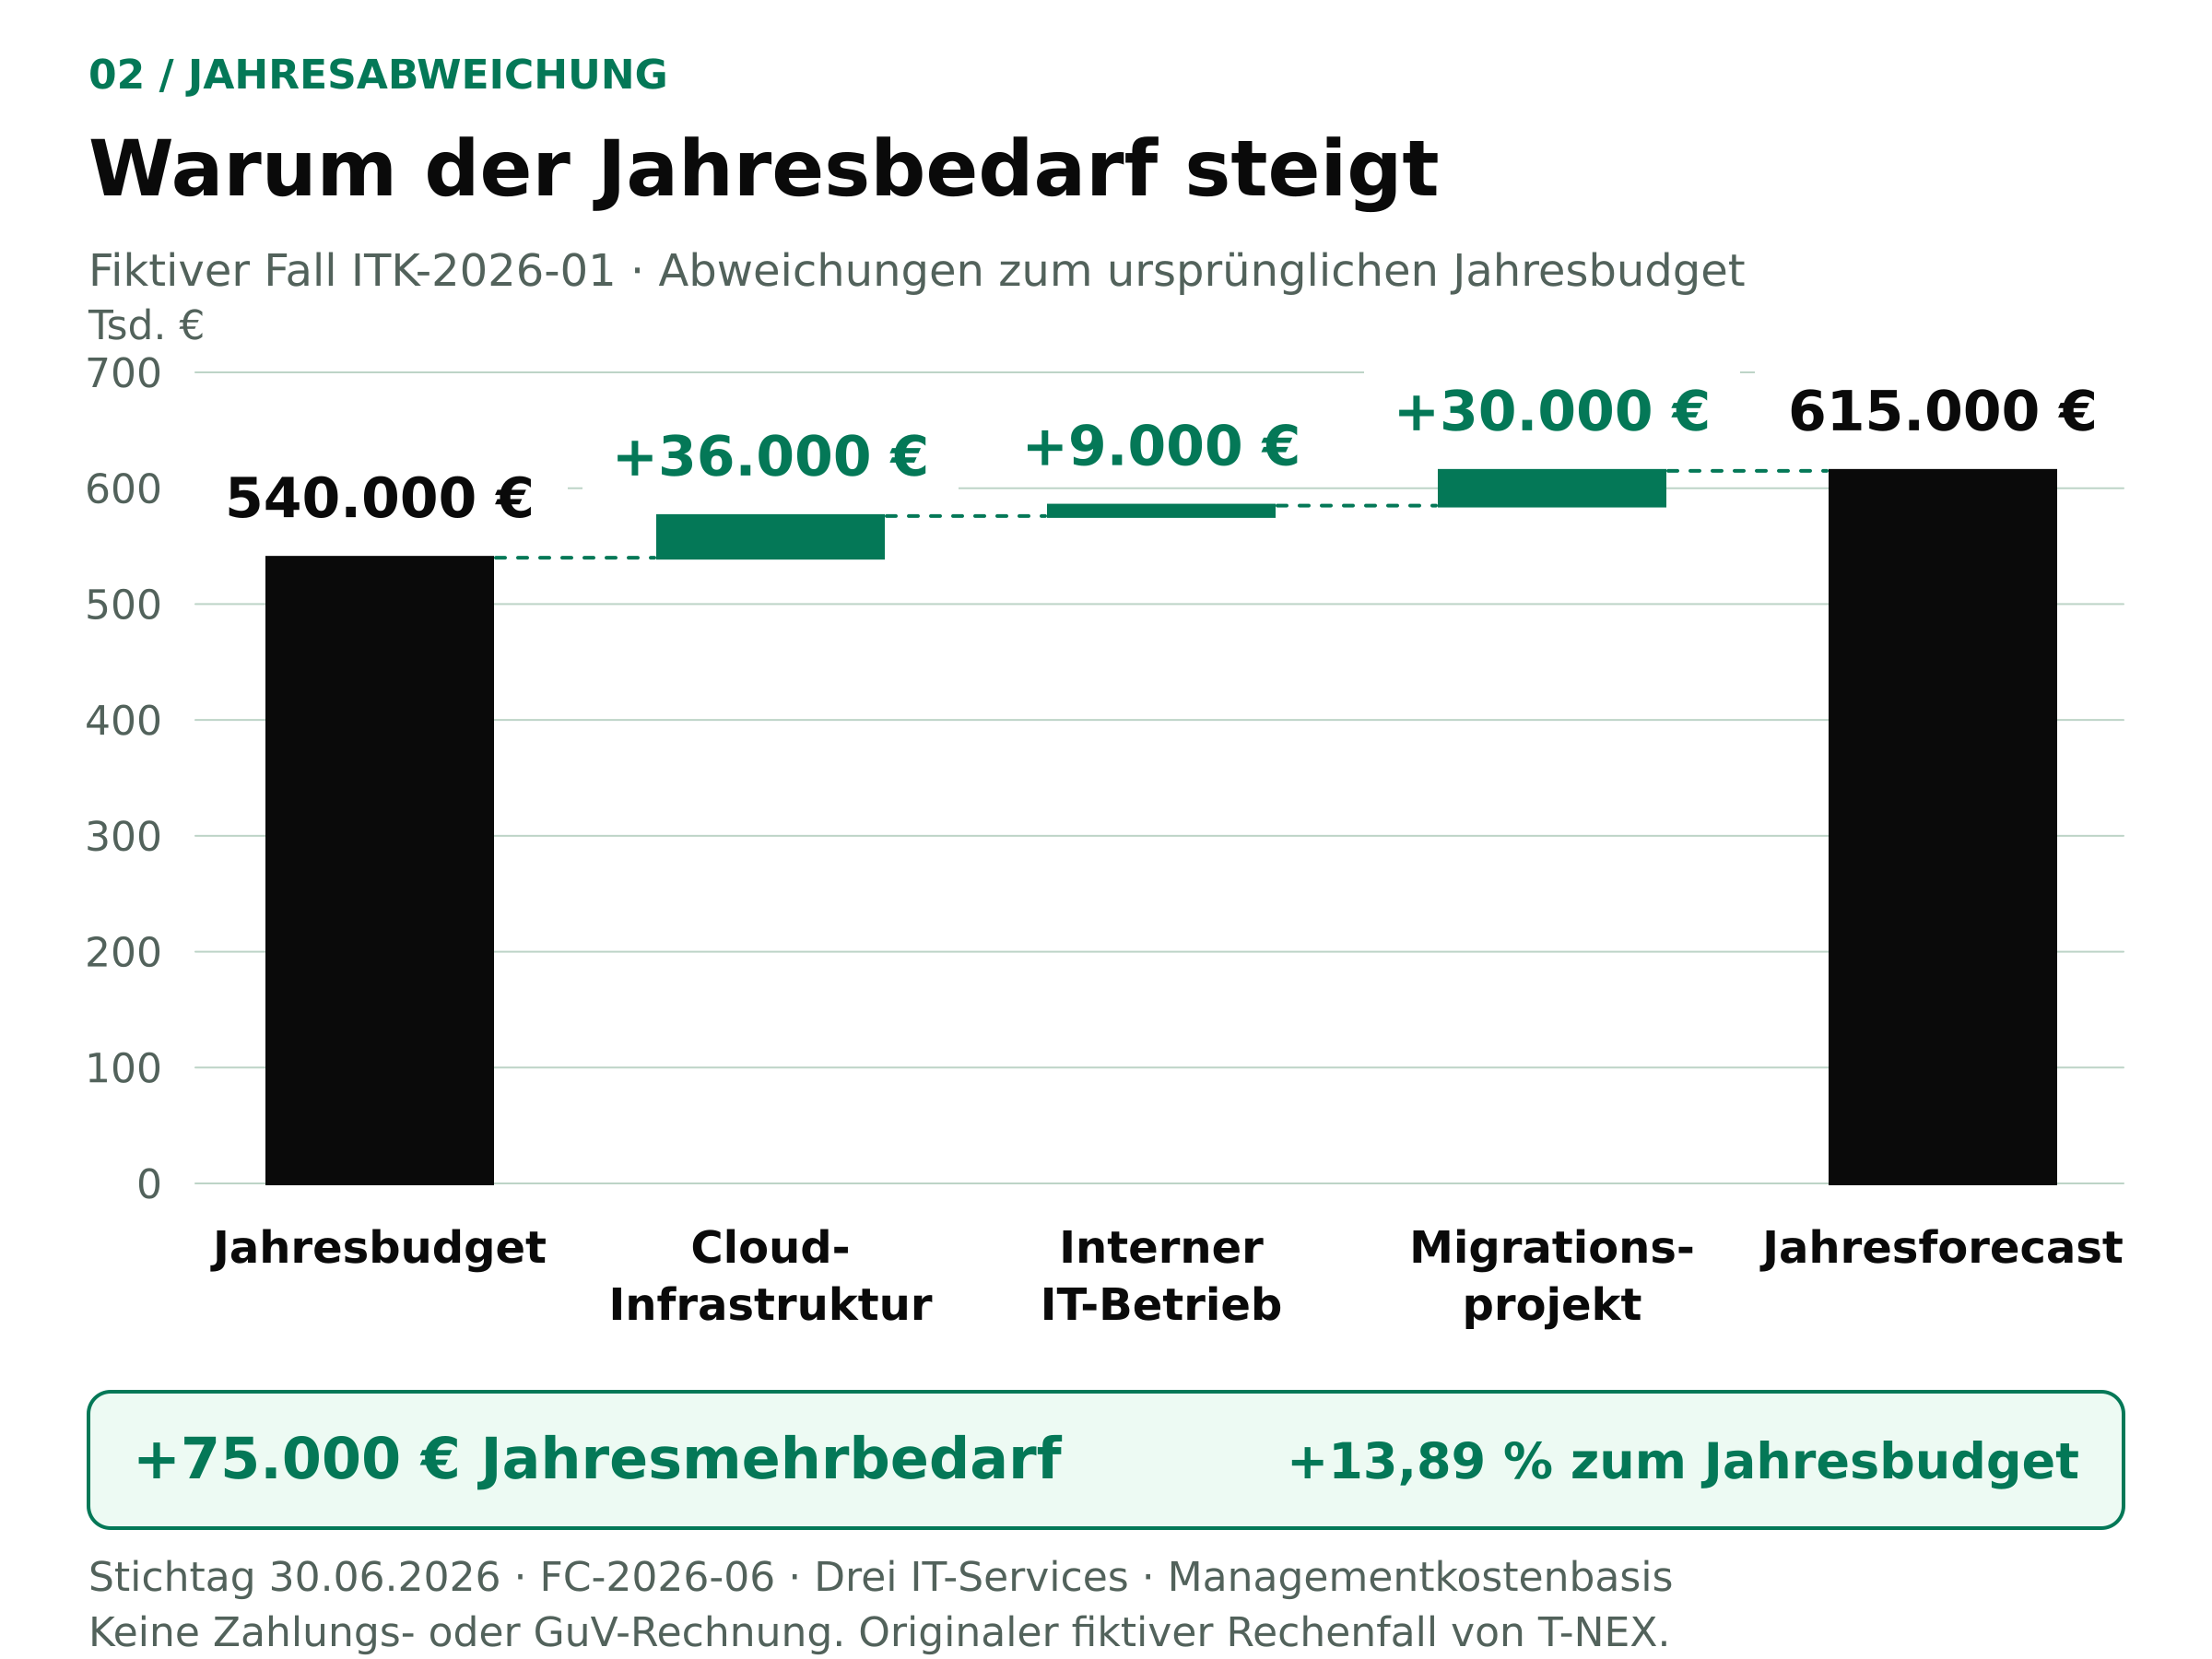
Why the annual requirement rises. Fictional case ITK-2026-01: EUR 540,000 annual budget plus EUR 36,000 cloud, EUR 9,000 internal operations and EUR 30,000 migration result in an annual forecast of EUR 615,000. The value scale starts at zero. Management cost basis, not a payment or income statement calculation.
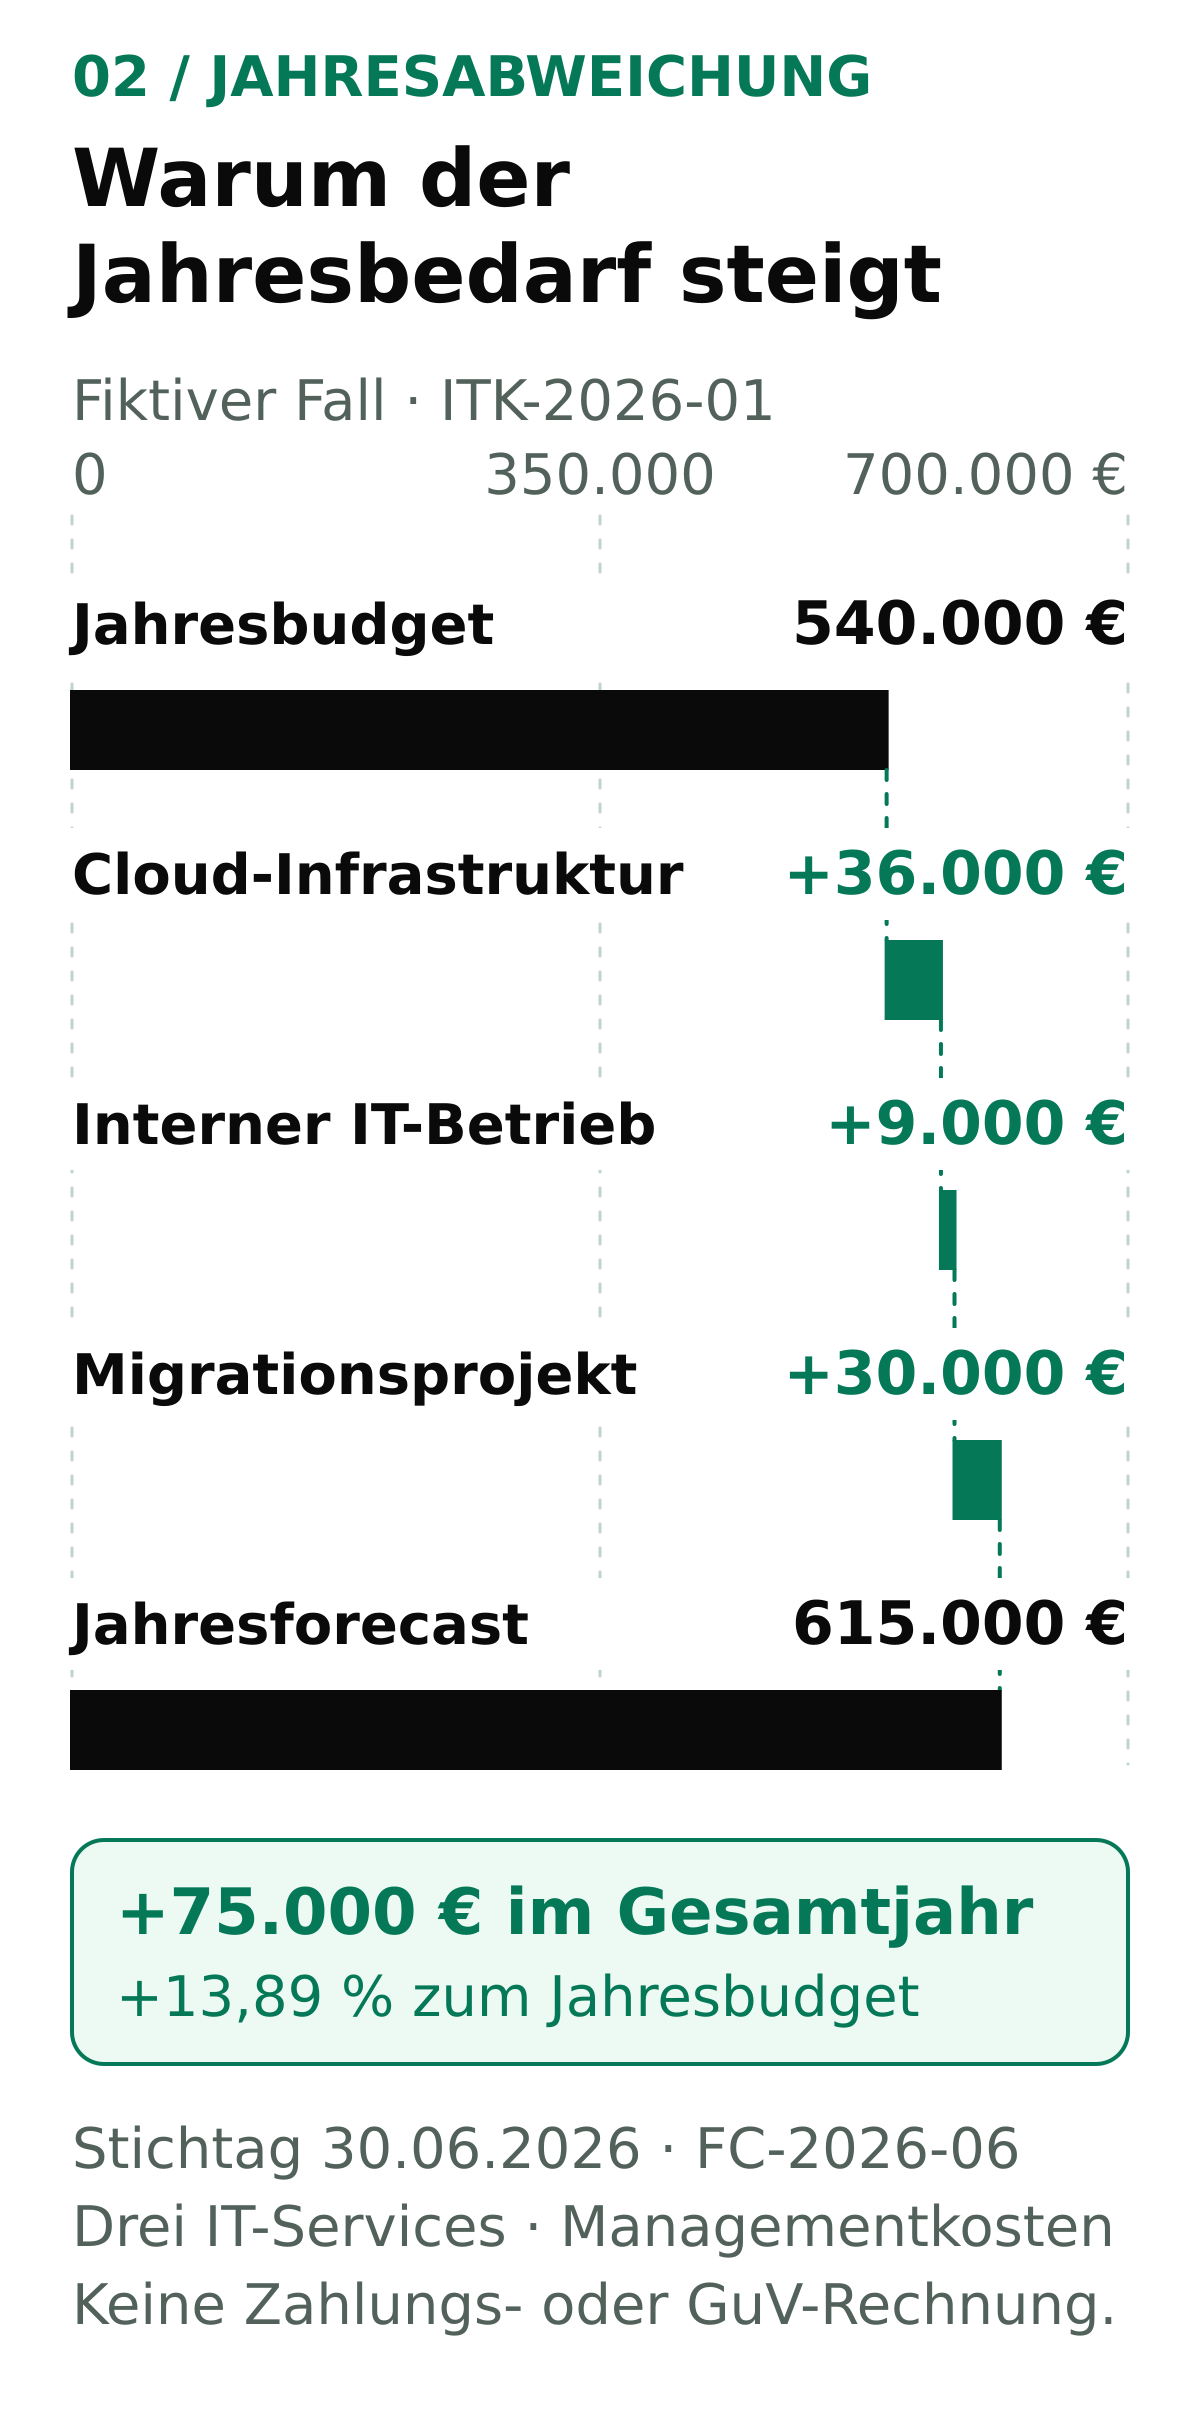
The statement that belongs in the management report
“As at 30.06., actuals are within the total budget for the half-year. The annual forecast is EUR 615,000 and exceeds the original budget by EUR 75,000 or 13.89 per cent. Significant drivers are cloud, internal operations and the migration, which has not yet been completed.”
Even a simple doubling of the half-year actuals would be inadequate here: it would give EUR 600,000 and would be EUR 15,000 below the current forecast. The planned changes in the second half-year must be expressly included in the expectation. That is precisely the difference between an extrapolation and a substantiated forecast. [2]
03 / Data and responsible persons
From the invoice to the IT service
A service provider invoice first tells you who is billing what. It does not automatically answer which bank process uses the service or who decides on the future requirement. For a reliable allocation, each cost item needs at least a clear origin, the service period, the cost type and a responsible recipient.
The cost centre answers an organisational question, the service a question of service delivery. An internal order, in turn, can bundle a transaction or a project. These dimensions may coexist. With statistical account assignment, it must be particularly clear which view serves only for analysis. The SAP documentation accordingly distinguishes between statistical and real account assignments. [6]
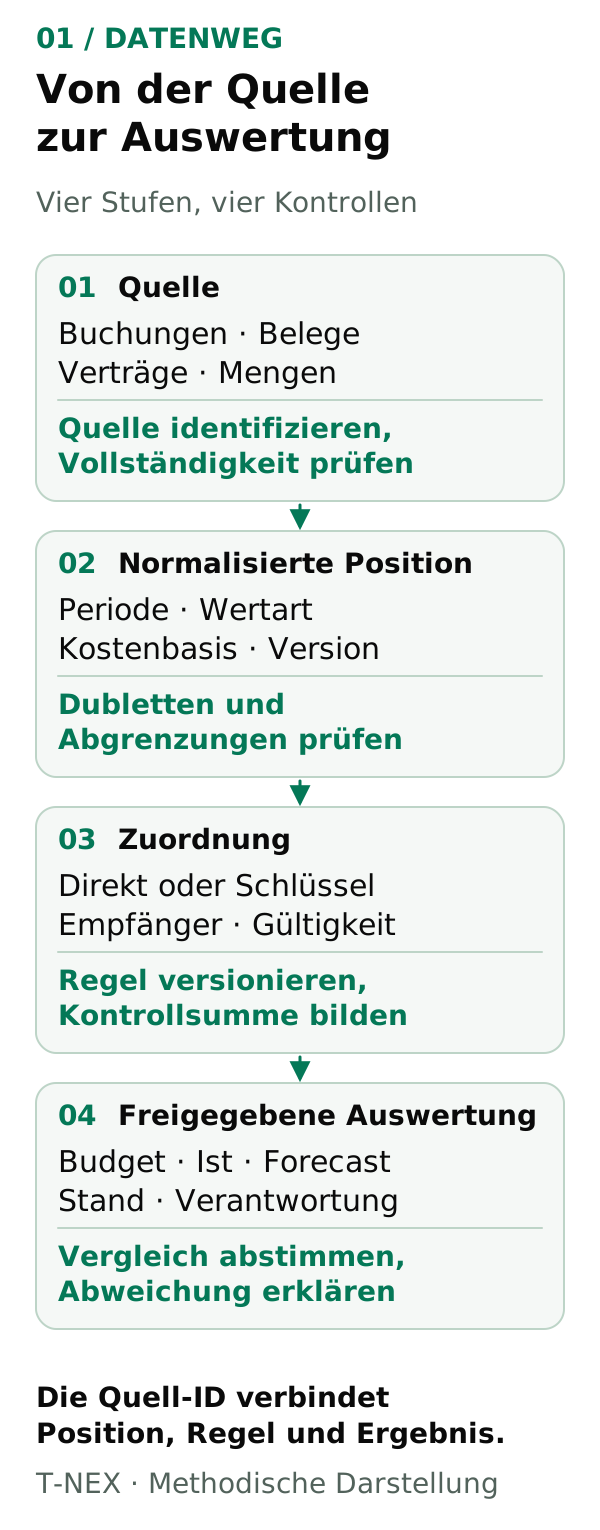
From the source to the approved report. Four data stages with their own controls. The source ID remains linked to the item, the assignment rule and the result. Methodological illustration, not a product view and not a posting instruction.
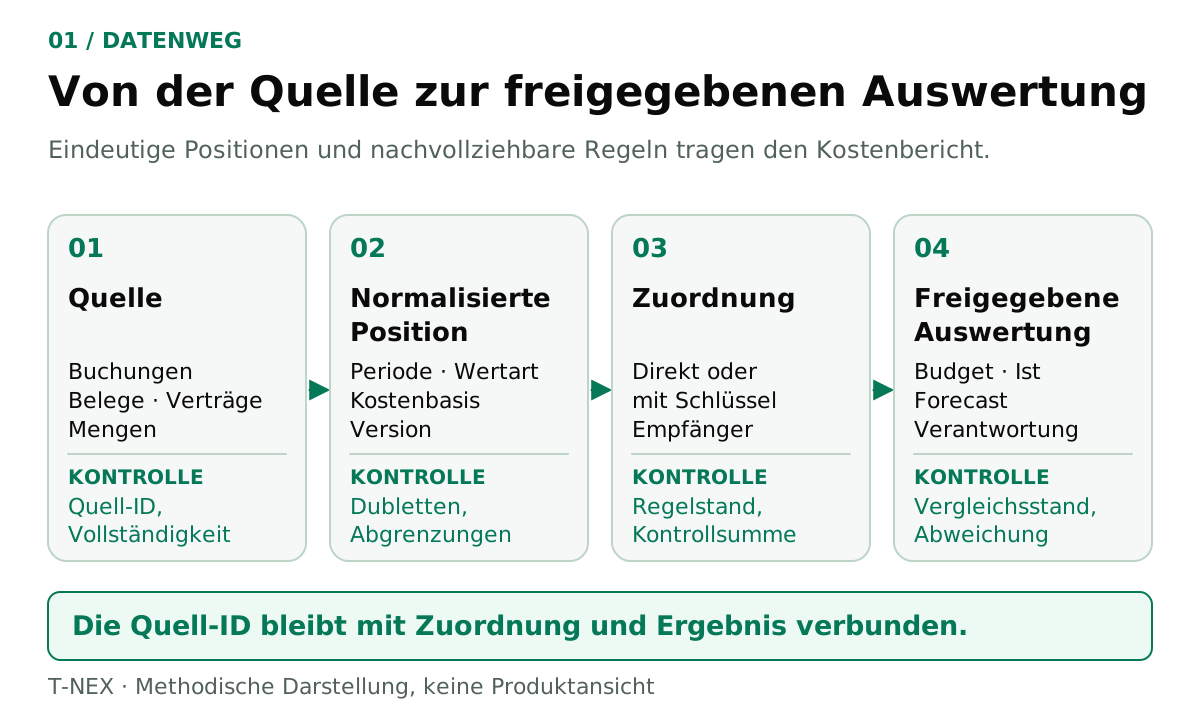
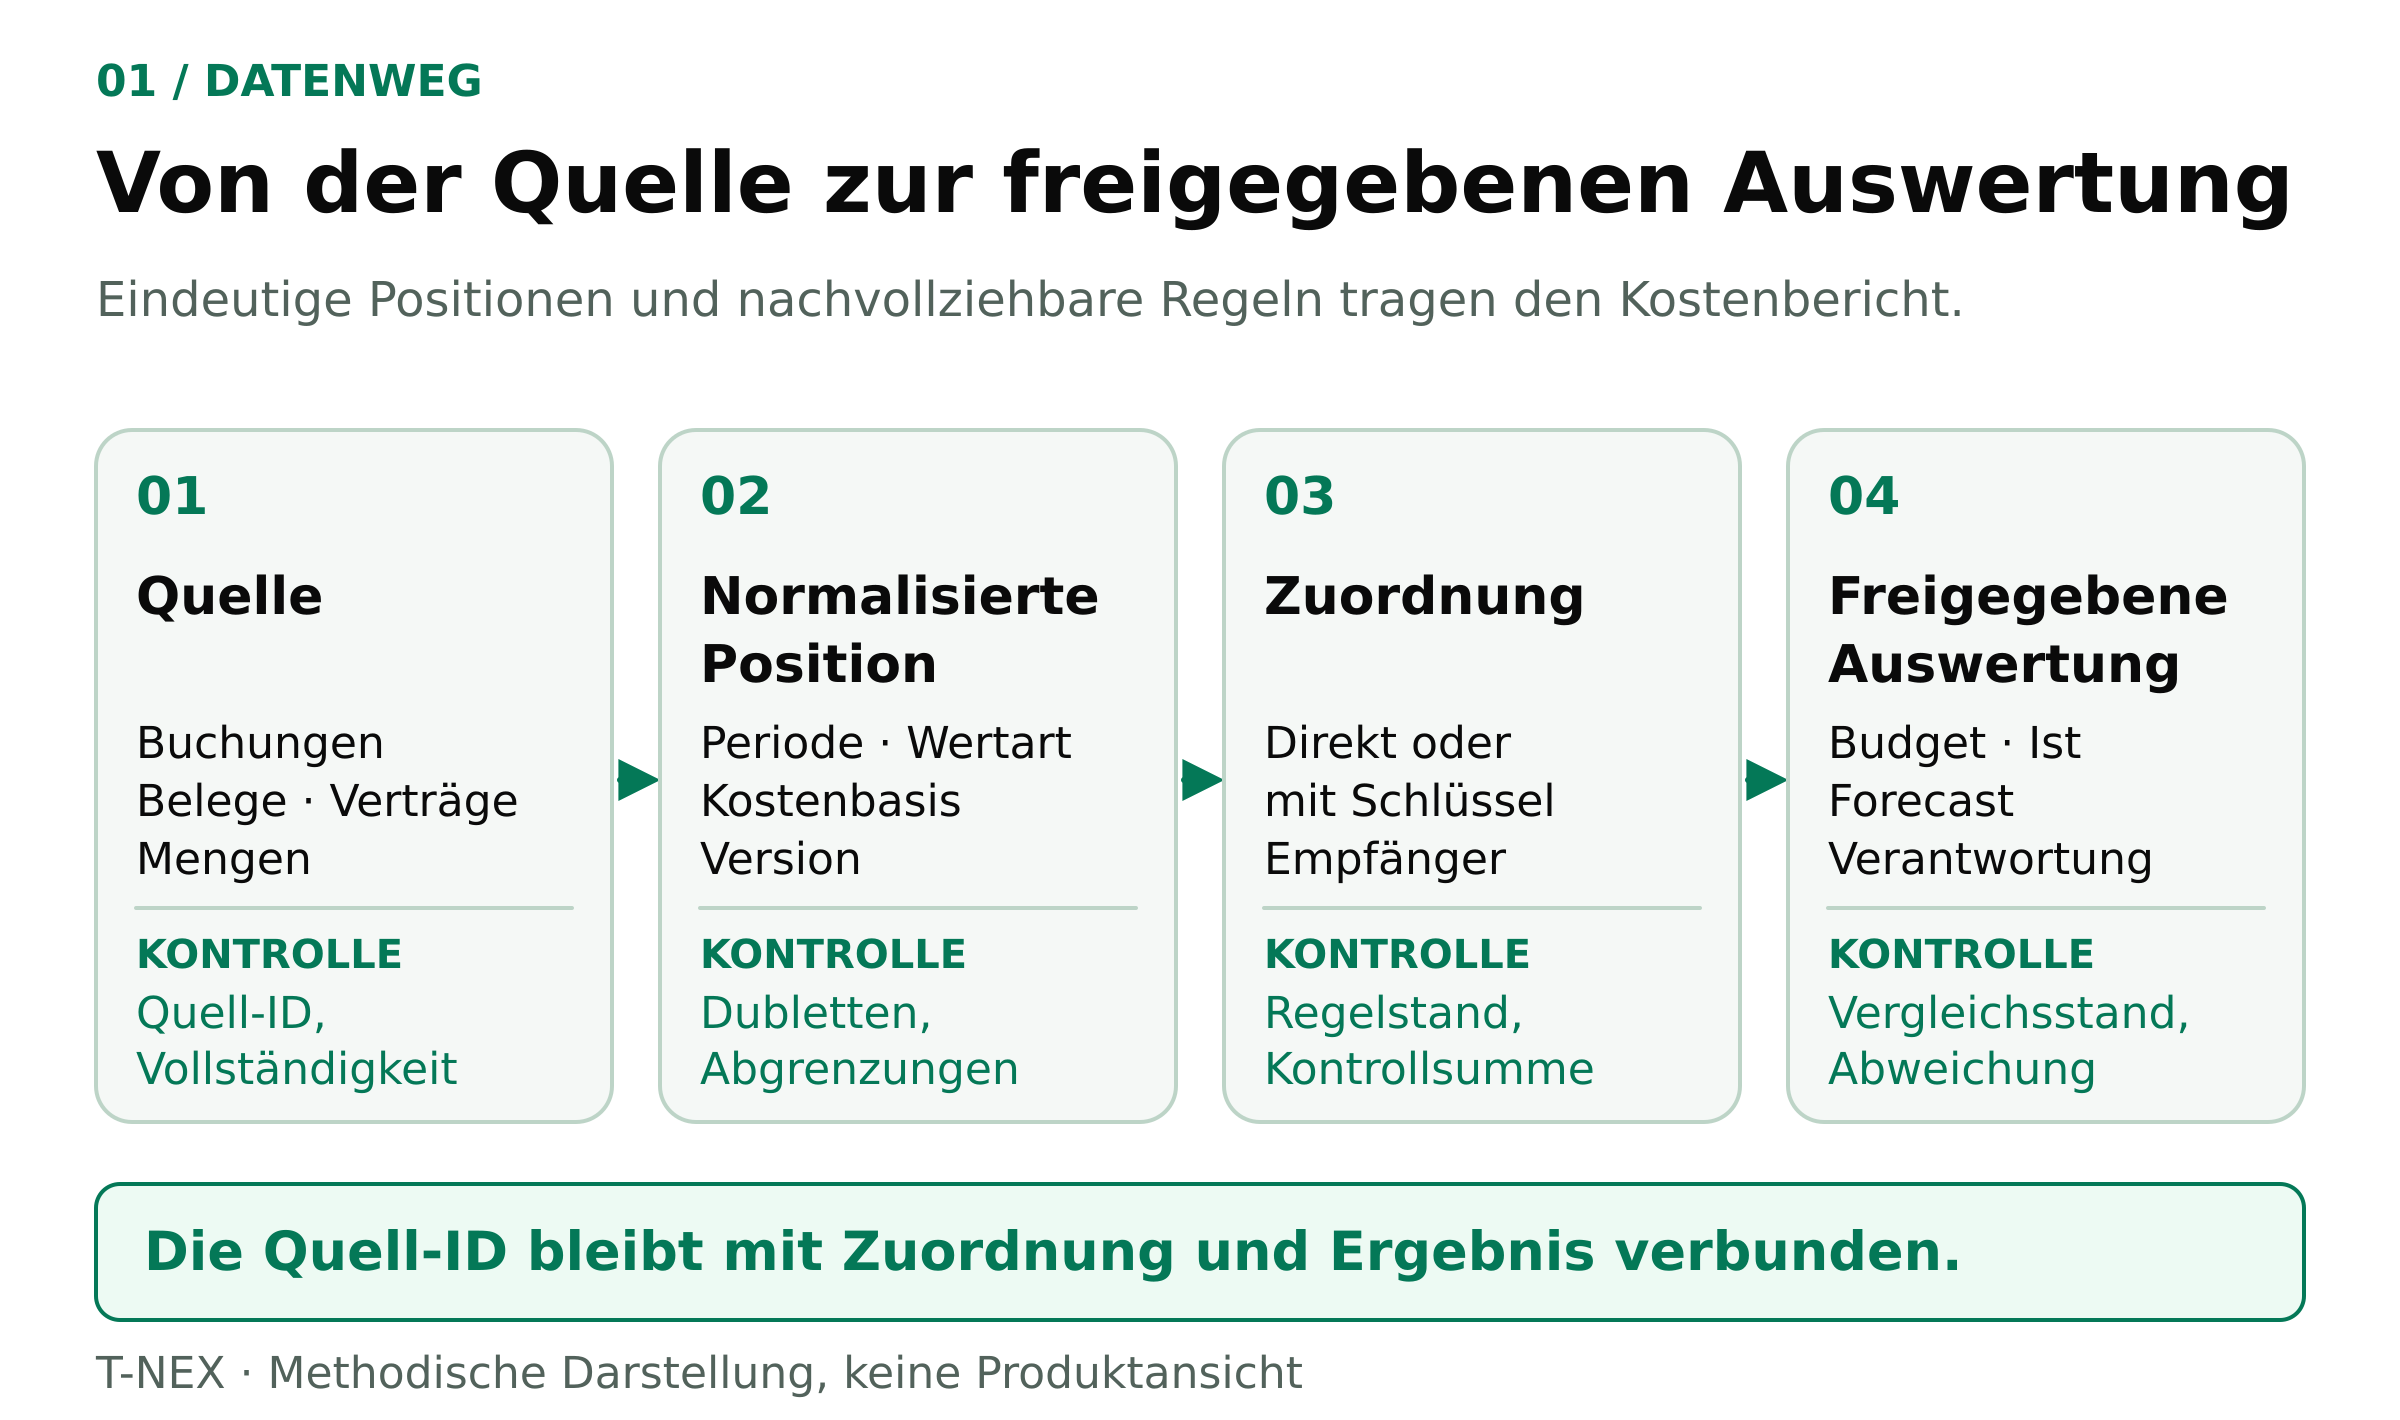
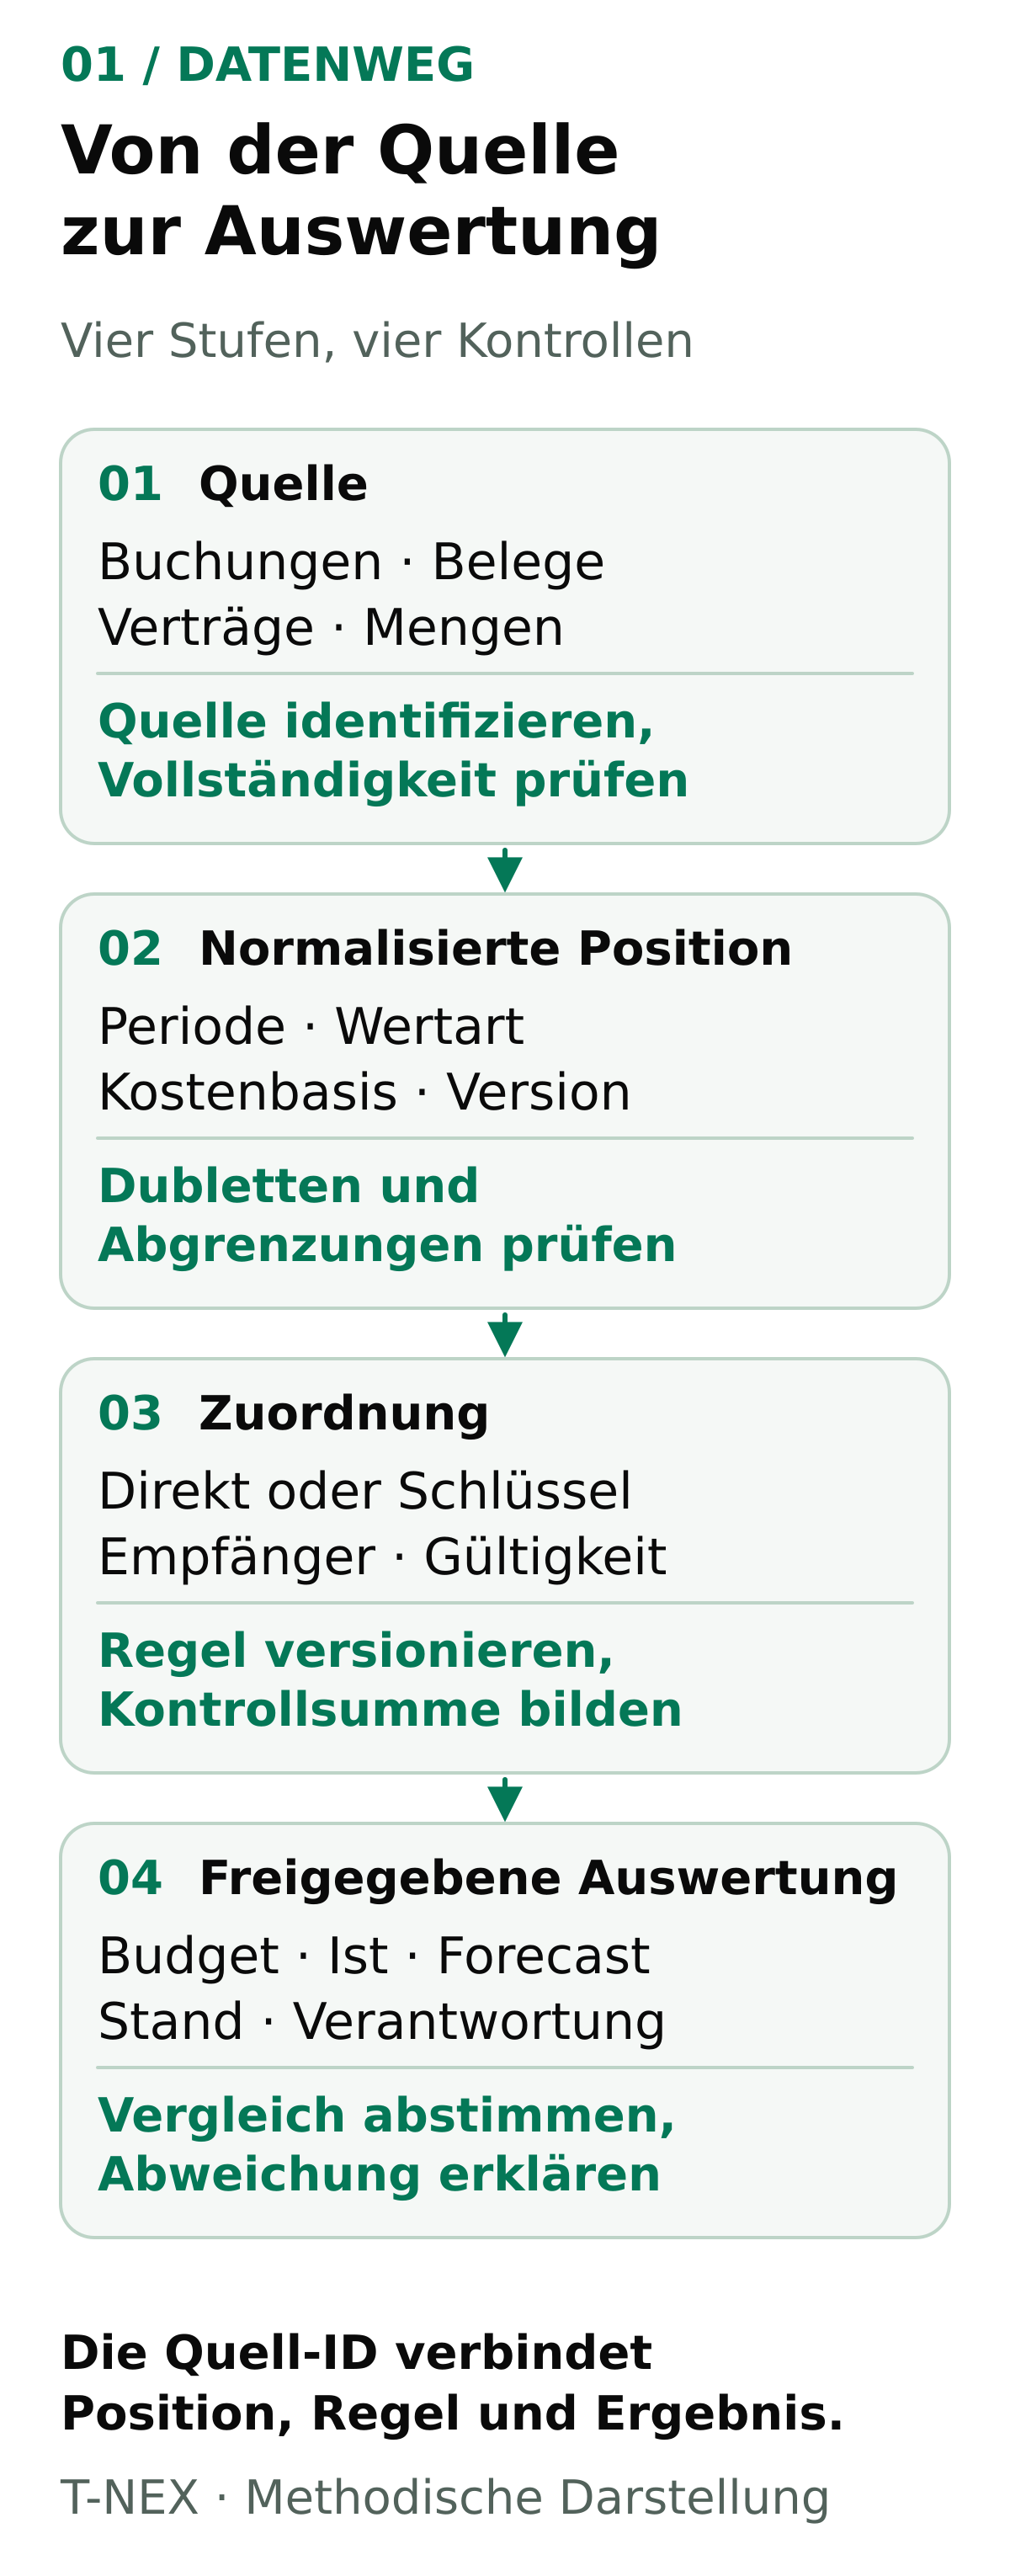
These fields belong in the assignment rule
- Source and key: Document or import ID, item ID and source system. Multiple imports must remain recognisable.
- Time and value type: Service month, posting status, actuals/budget/forecast and cost basis. An import date does not replace a service period.
- Recipient: Cost centre, IT service, where applicable project or internal order. Unresolved items receive a visible clarification status.
- Rule and responsibility: Direct assignment or key, valid from/to, rule version, responsible subject-matter owner and documented approval.
In the sample case, the sources are called C01 to C05 and the service recipients S-K, S-R and S-W. Rule version DRV-01 applies here, in simplified form, to all periods considered. A real model must delimit changes in time. A key changed in July must not silently redistribute the January actuals that have already been reported.
The TBM taxonomy offers a more comprehensive framework for this: it connects cost pools and technology resources with solutions and consumers. The small case in this article does not fully reproduce this taxonomy. It shows the fundamental benefit of a clear link between the financial view and the service view. [5]
04 / Checking causes
Rule out the error first, then explain the additional costs
A subject-matter assessment is preceded by a short data check: Is an invoice missing? Was the same item imported twice? Is a credit note included? Do actuals and budget belong to the same period? Was both the payment and the accrued amount inadvertently taken from a prepaid item?
An unknown amount remains marked as open; it is not replaced by zero. A correction needs a reason, evidence, a responsible person and a new data status. The affected totals are then reconciled again.
After that, genuine changes can be investigated. Price, quantity, scope of service and timing shifts require different measures. A changed allocation is something else again: it initially changes the recipient, not the total costs.
An allocation error does not save money
If, in the case, EUR 6,000 of licence costs are inadvertently assigned to the digital workplace instead of regulatory reporting, an annual forecast of EUR 88,200 instead of EUR 82,200 appears there. Regulatory reporting shows EUR 197,100 instead of EUR 203,100. After correction, both services are right again; the total costs remain at EUR 615,000. Data quality has improved; no saving has arisen.
Breaking down price and quantity with a fixed calculation rule
A separate calculation example shows the method: the plan is 1,000 service units at EUR 10, that is EUR 10,000. In fact, 1,200 units are used at EUR 11, that is EUR 13,200. The variance is EUR 3,200. It is broken down here in a fixed sequence:
- Price effect at planned quantity: (11 − 10) × 1,000 = EUR 1,000.
- Quantity effect at the new price: (1,200 − 1,000) × 11 = EUR 2,200.
- Reconciliation: 1,000 + 2,200 = EUR 3,200.
A different decomposition sequence distributes the joint price-quantity effect differently. The method therefore belongs to the metric. With changing service packages, tiered prices or discounts, this simple model is not sufficient. The example is independent of the cloud item C01; it does not explain its specific EUR 36,000 annual variance.
To check a service provider invoice, quantities, tariffs, agreed services and the service period are compared with the contract and actual usage. A conspicuous amount is a review prompt. Whether the invoice is wrong can only be decided from this evidence.
05 / Allocating costs
Distributing shared costs without counting them twice
Costs that can be directly assigned remain directly assigned. For jointly used infrastructure, a substantiated key is needed. Usage data, time shares or weighted support services can be suitable for this. Distribution by headcount only makes sense if it sufficiently explains the service in question. The FinOps Foundation describes several methods and also the option of deliberately bearing certain costs centrally. [3] [4]
| Cost source | Reason for allocation | Credit processing S-K | Regulatory reporting S-R | Workplace S-W |
|---|---|---|---|---|
| C01 Cloud | Normalised usage, ratio 600:300:100 | 60 % | 30 % | 10 % |
| C02 Licences | Direct licence items per year | 48,000 EUR | 36,000 EUR | 12,000 EUR |
| C03 Internal operations | Documented time shares | 50 % | 30 % | 20 % |
| C04 Support | Weighted service units | 40 % | 40 % | 20 % |
| C05 Migration | Direct project work packages | 2/3 | 1/3 | 0 |
For support, the model counts the weighted service. A raw ticket count might misrepresent the effort of transactions of differing complexity. The licence amounts are direct assignments; they are not a general allocation key for other cost types.
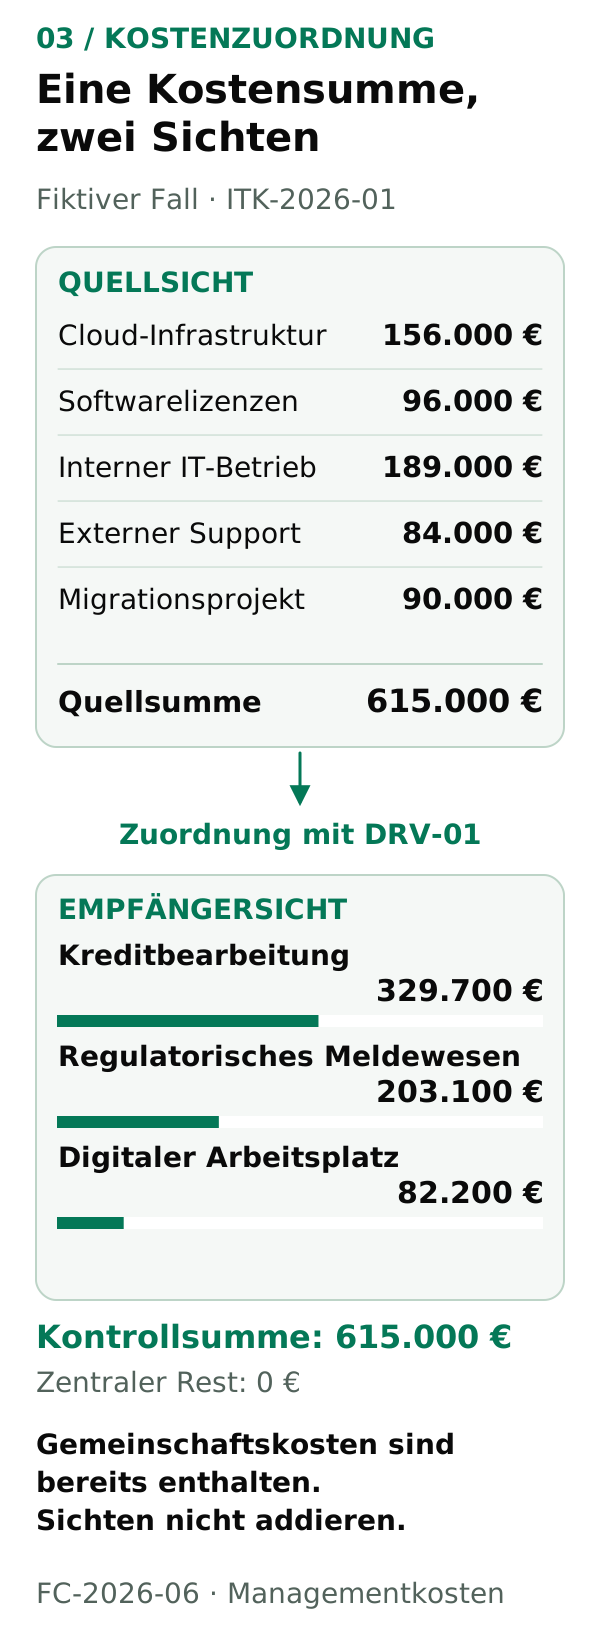
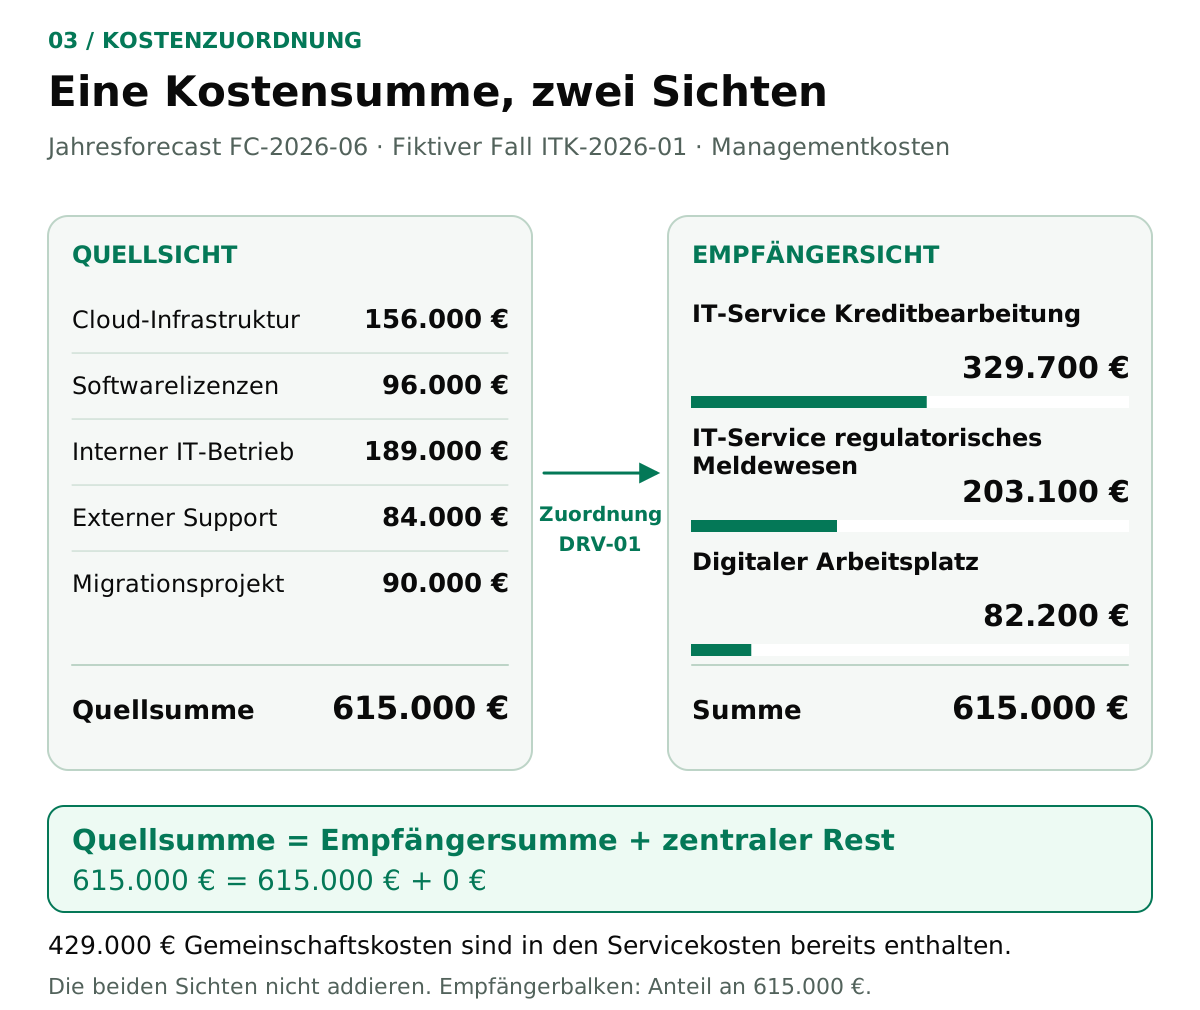
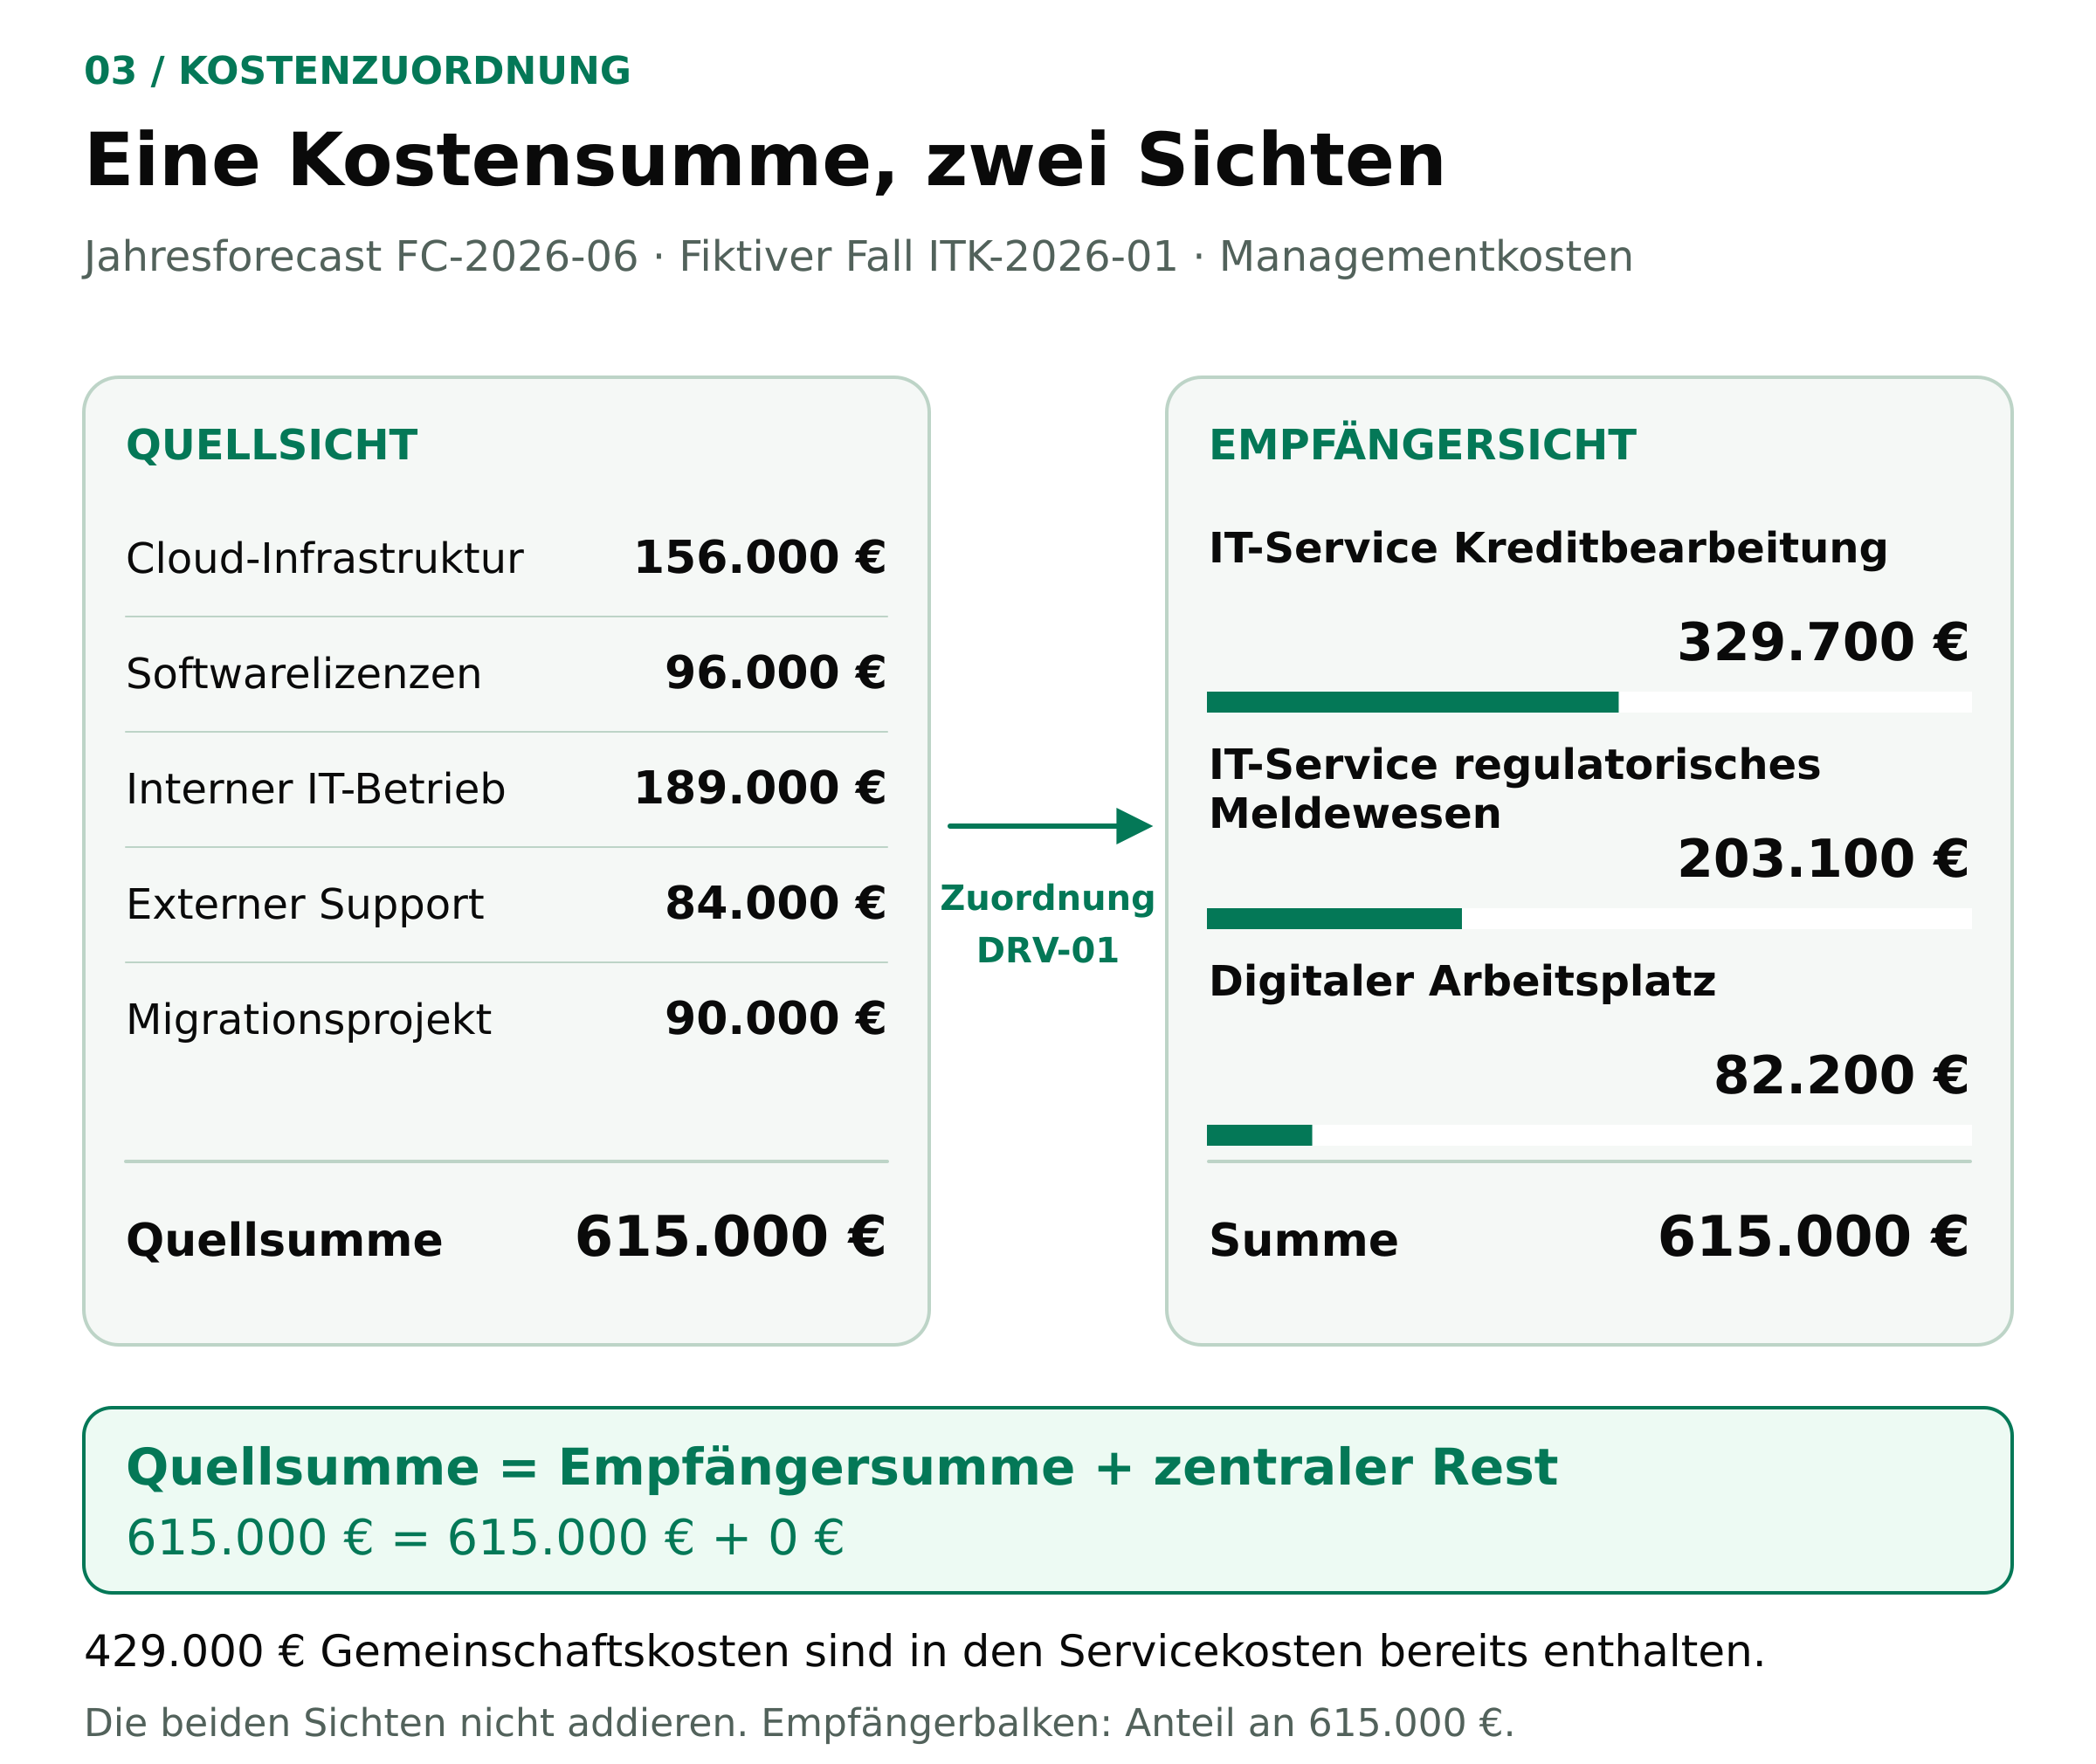
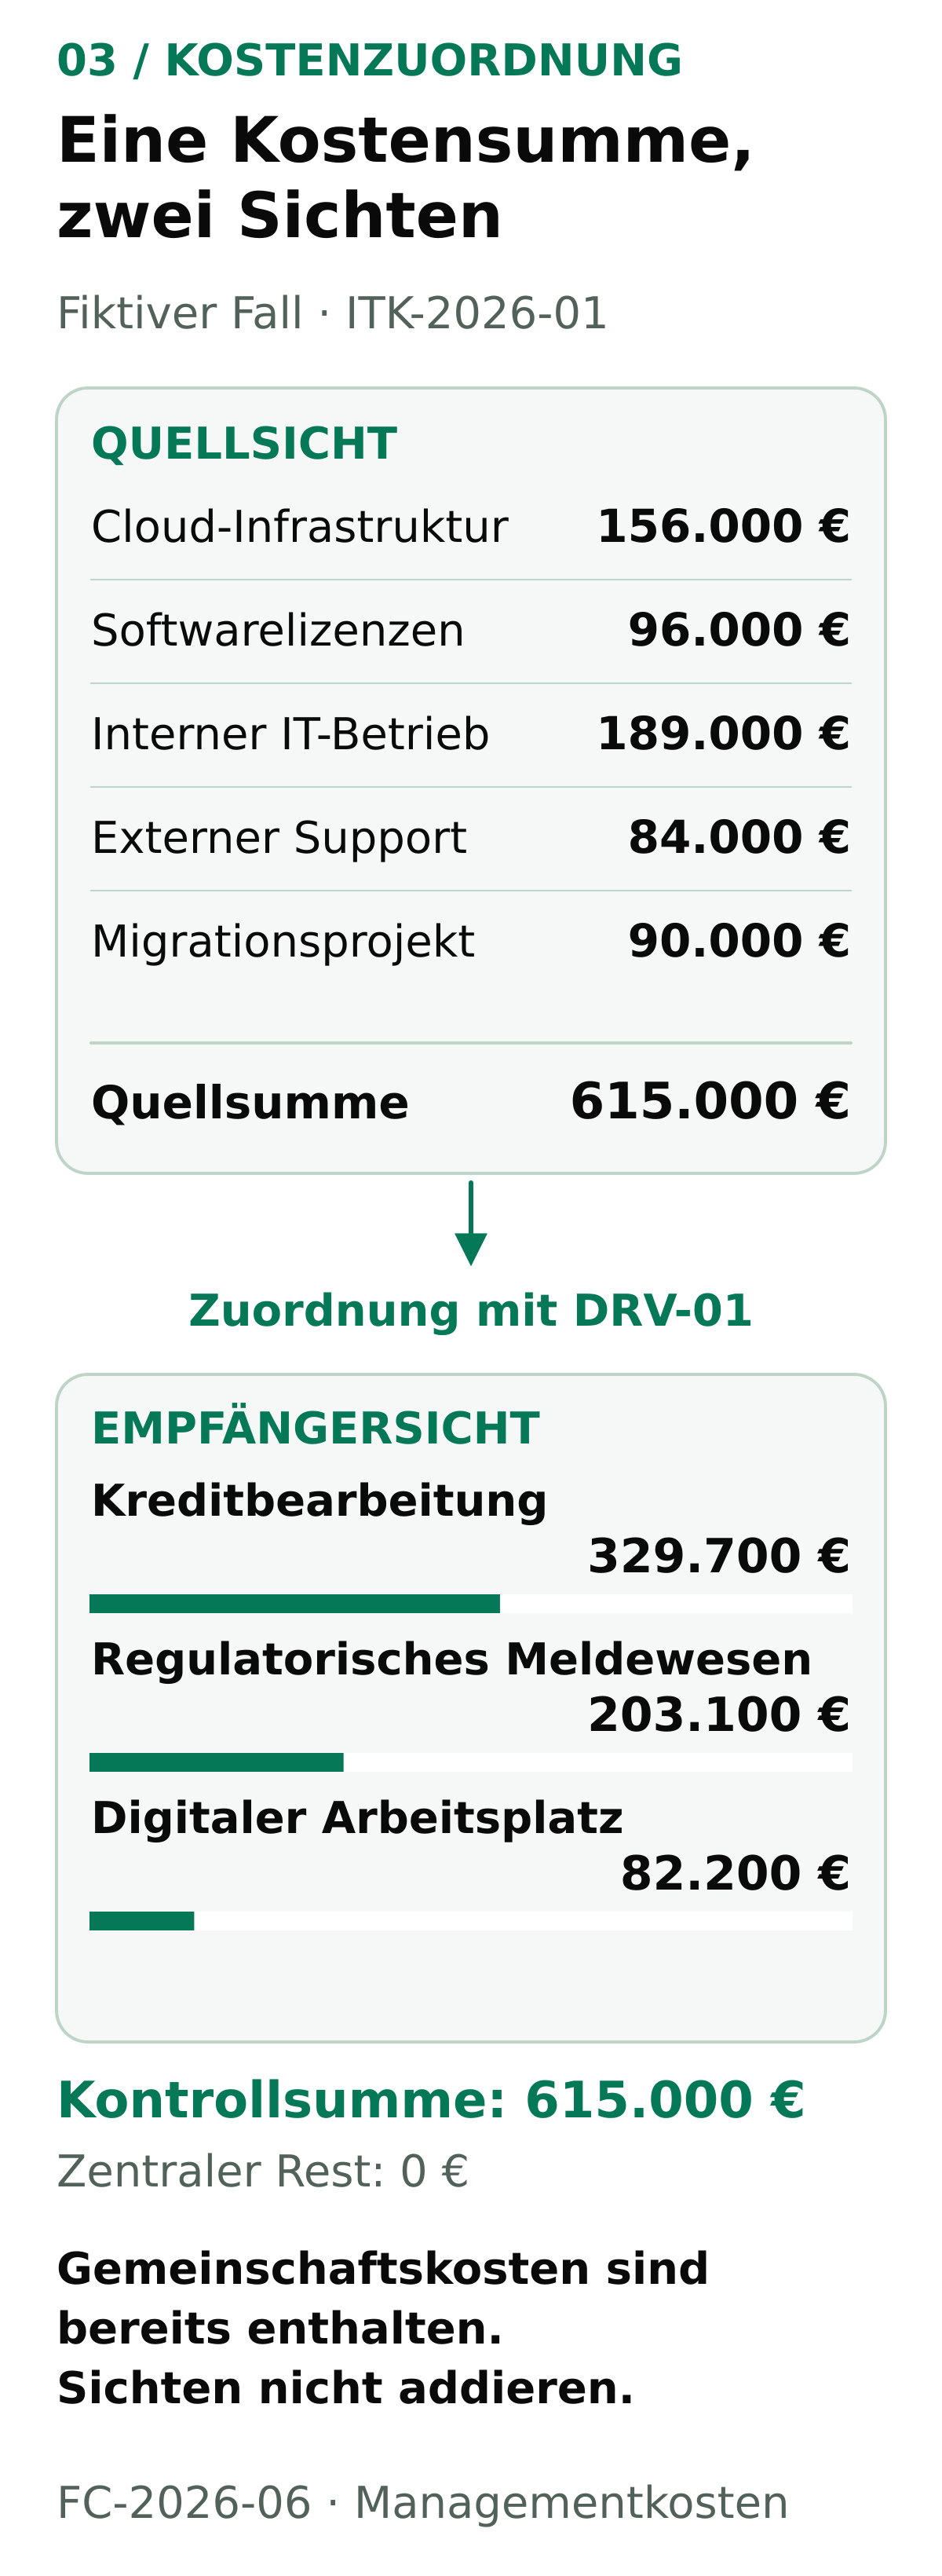
One cost total, two views. The five cost sources and the three service recipients each show the same EUR 615,000. EUR 429,000 of shared costs is already included. The central remainder is zero in the model; sources and recipients are not added together.
| IT service recipient | Budget year | Actuals H1 | Forecast year | Variance year |
|---|---|---|---|---|
| S-K Credit processing | 283.600 | 161.000 | 329.700 | +46.100 |
| S-R Regulatory reporting | 179.600 | 99.400 | 203.100 | +23.500 |
| S-W Digital workplace | 76.800 | 39.600 | 82.200 | +5.400 |
| Total | 540.000 | 300.000 | 615.000 | +75.000 |
+ costs remaining centrally 0 EUR
The EUR 429,000 of shared costs is already included in the EUR 615,000 of service costs. Anyone who adds it again wrongly reports EUR 1,044,000. Sources and recipients are two views of the same costs. In the example, everything is distributed; an item deliberately remaining central would be possible and would have to stay visible in the reconciliation. The example amounts divide without a rounding remainder. With cent amounts, the real model additionally needs a documented rule for distributing rounding remainders.
Showback and chargeback are different steps
Showback makes the allocated consumption and its costs visible to those responsible. Chargeback charges a recipient according to agreed charging rules. A distribution in a report does not automatically trigger a posting. Service price calculation, allocation in the report and accounting-based charging should therefore also be described separately. In T-NEX Controlling, cost allocation models take effect in the reports; the actual postings in accounting are not generated as a result. [8]
06 / Planning the rest of the year
Orders belong in the forecast, not on top of it
The forecast for the rest of the year contains EUR 315,000. Of this, EUR 174,000 is attributable to external purchase commitments and EUR 141,000 to other estimates, including internal resources. The two amounts explain the composition of the remaining requirement. They are not additional costs alongside it.
+ Purchase commitments H2 EUR 174,000
+ other estimate H2 EUR 141,000
Anyone who adds the EUR 174,000 again to the complete forecast for the rest of the year counts it twice. Likewise, deliveries already included in actuals must not be treated again as open remaining requirement. For this, the order item, service rendered, invoice and remaining requirement must fit together.
“Purchase commitment” here refers only to the defined external measure. A zero for internal operations does not mean that there are no employment contracts or other obligations. Nor can a balance-sheet liability be derived from it.
What has changed since the last forecast
Every significant adjustment should name a traceable trigger: more usage, a new tariff, an extended migration or a requirement that has fallen away. This includes the period concerned, the source of the assumption and the responsible person. A new version replaces the old expectation in the current report but does not delete its history.
A possible cloud measure in the case would reduce the requirement for the rest of the year by EUR 18,000. That would give a scenario value of EUR 597,000. It is neither a realised saving nor the base forecast. Only when scope, feasibility, necessary service and decision have been clarified can such an assumption enter the next forecast.
07 / Management instead of filing
What should follow from a variance
A report does not end at a red field. In the sample case, three different assignments can be derived: the service owners explain the cloud usage, IT management and controlling assess the additional internal effort, and the project management updates the remaining migration scope. Purchasing or contract management clarify where quantities and terms can actually be changed.
| Finding | Decision to be clarified | Required evidence |
|---|---|---|
| Cloud +36,000 EUR | Which usage is necessary, and which can be changed in a way that is justifiable from a subject-matter perspective? | Usage, agreed price, service requirement, documented scenario. |
| Internal operations +9,000 EUR | What additional requirement is planned, and whom does it serve? | Resource assumption, task reference, period and responsible approval. |
| Migration +30,000 EUR | Which remaining scope and which completion date are reliable? | Remaining effort planning, dependencies, project decision and follow-on costs. |
For each assignment, the responsible persons, deadline and outcome are recorded. Not every variance leads to a cut. Sometimes additional requirements are objectively justified; sometimes an initiative has to be reprioritised. The decision then needs the affected service, the expected effect and the consequences for service and risk.
How service provider relationships are classified organisationally is covered in the article on outsourcing in banks. For the prescribed register information on ICT contracts, the DORA register of information is the more suitable starting point. A cost overview does not replace these tasks.
08 / Using AI sensibly
A good AI answer needs more than a plausible explanation
In IT controlling, a sensible use of AI is to make existing information accessible more quickly: finding relevant items, summarising changes and preparing follow-up questions. For reliable results, however, the answer must show which data and definitions it refers to. A linguistically convincing justification without evidence helps little with a budget decision.
Voice from banking practice
Andy Price on selecting AI initiatives
Price assesses AI initiatives by the same economic standards as other technology projects. An expensive solution for a rare task does not convince him. Recurring processes with a high manual effort offer a better starting point. In the selection, besides efficiency, accuracy, response time and the benefit to the business count for him. Capacity that is freed up should benefit more demanding work. For the decision, it is therefore necessary to examine which effort actually changes and which subject-matter outcome the investment serves.
Paraphrase based on the transcript, not a verbatim quotation. Andy Price, Head of Technology & Operations at BofA Securities Europe S.A., in the AI Adoption Podcast, passage from 21:35; additional context from 08:49. No statement about T-NEX or a measured effect in IT controlling. [10] [11]
A review question with an expectable answer
For the sample case, a specific question is: “Why is our annual forecast EUR 75,000 above BUD-2026-01, although actuals to June are within budget?” A reliable answer must identify version FC-2026-06, the five cost items and the masked half-year variance. It must not turn the delayed project costs into a saving.
- Evidence: Are the source, period, value type and rule version named?
- Calculation: Do the partial amounts match the EUR 75,000?
- Uncertainty: Does it remain recognisable which future costs are based on assumptions?
- Authorisation: Is the answer limited to the data approved for the person asking?
- Action: Do analysis, proposed measure and approved change remain separate?
The bank measures the benefit of such a use in the specific workflow: for example by search and reconciliation time, subject-matter corrections or traceable source references. Free capacity is not yet a cash-effective saving. Nor are rule-based controls or a processing run generative AI merely because they automate work.
09 / Implementation with T-NEX
Cost management in the context of the Banking Platform
For a bank, the link between a cost item and the follow-up decision is often more laborious than the addition itself. The T-NEX AI Controlling Hub connects data import, planning and reporting for this purpose. It is part of the Banking Platform, which addresses further work areas such as reporting and project management. This allows the controlling task to be considered in the context of the processes from which costs and measures arise. [8] [9]
Import data
Imports with history and logs create a traceable starting point.
Edit planning
Planning screens and reference comparisons support work on different value types.
Evaluate allocation
Sources, targets, shares and validity periods make cost allocation models verifiable.
The product documentation describes, among other things, cost centres, internal orders, cost types and services as well as contract and order references. Among the value types distinguished are actuals, obligo, budget, Plan-IT and financial plan. Their subject-matter definition and the appropriate comparisons are to be set in the respective data model. For planning runs, a preview is available before processing. Such a planning assistant is a processing step; no promise of an automatically generated, accurate annual forecast follows from it. [8]
In the case, the identified additional migration requirement could be passed to project management and linked to the management report. Which data links between AI Project Management, AI Reporting and controlling are set up for an institution has to be clarified in the specific deployment. The platform link does not replace a review of the data model, permissions and interfaces.
Five tasks for a meaningful software demo
- Trace an item back: Switch from the service report to the cost source. Import status, service period and the rule used must be recognisable.
- Change a key: Limit the validity to a new period and check whether the old view remains reproducible.
- Preview a planning run: Check the effects of a run before values are processed. Check responsibility and approval in the specific procedure.
- Reconcile the total: Compare source costs, allocated service costs and the central remainder. The EUR 615,000 must not grow through the distribution.
- Substantiate an AI answer: Have the case with the EUR 75,000 variance explained. Check source reference, calculation path, authorisation and handling of missing data.
These tasks are a proposed acceptance catalogue. They do not claim that every function is available without set-up, additional data or project-specific coordination. Product basis: public pages and the complete controlling manual dated 25.08.2026; no customer data adopted.
Review your own cost case together
Bring an anonymised cost structure, the value types you use and a typical unresolved variance. This allows a concrete discussion of which data are available, which allocation is missing and how the workflow can be mapped in T-NEX.
Discuss IT controlling with T-NEXFurther reading: T-NEX for IT controlling · Consulting for regulated markets · Evidence and references
10 / Continue working directly
Sample case, worksheet and calculation data
The materials contain the same case as the article. They make the cost basis, sources, allocation rules and control totals openly verifiable. The blank template can be filled in for your own, cleaned-up extract. All materials are in German and available without registration.
Completed sample case
All starting values, allocations and control equations, including two separate examples on price/quantity and incorrect allocation.
Open HTMLDownload HTML (German)Data as JSON (German)Version 1.0 · As at 16.10.2026HTML 105 KB · JSON 20 KB
Blank worksheet
Manually fillable fields for cost basis, items, rules, forecast and decisions. No automatic saving or calculation.
Open HTMLDownload HTML (German)Data as JSON (German)Version 1.0 · As at 16.10.2026HTML 109 KB · JSON 14 KB
Calculation data and data dictionary
Two CSV files with semicolon as separator and UTF-8 encoding. The data dictionary explains fields, value types and calculation rules.
Source costs as CSV (2 KB) (German)Service allocation as CSV (3 KB) (German)Data dictionary as HTML (90 KB) (German)The HTML worksheet can be filled in and printed in the browser. Entries are not saved automatically. Before closing, print as PDF or transfer to your own system. The JSON files are intended for further processing; the CSV files contain the modelled data, not real bank information.
Check before the next controlling round
- Are the source, cost basis and service period of each item unambiguous?
- Do the original budget and the current forecast remain separate?
- Are direct costs allocated before shared costs?
- Are allocation keys, validity and responsible persons documented?
- Does the sum of recipient costs and central remainder equal the source costs?
- Are purchase commitments already included in the forecast for the rest of the year?
- Are timing shifts separated from actual cost changes?
- For every significant variance, are the cause, assignment and responsible person established?
Questions from practice
Frequently asked questions on IT cost controlling
What distinguishes IT cost controlling from IT cost allocation?
IT cost controlling covers transparency, planning, analysis and management. IT cost allocation assigns costs to recipients according to defined rules. An allocation in a report must be distinguished from an actual accounting charge. For a decision, besides the allocated amount, one also needs its cause and the future requirement.
Can a bank exceed its annual budget despite keeping to its half-year budget?
Yes. In the fictional case, EUR 300,000 of actuals is set against an equal half-year budget. In the second half-year, however, a further EUR 315,000 is expected. This results in an annual forecast of EUR 615,000 instead of a budget of EUR 540,000. The delay in the migration masks the higher cloud costs in the half-year.
How is the annual IT forecast calculated?
On a uniform cost basis, the actuals to the cut-off date and the expected costs of the rest of the year are added. In the case: 300,000 + 315,000 = EUR 615,000. Purchase commitments already contained in it are not added again. Quantities, prices, schedule shifts and the planned scope of service substantiate the assumptions for the rest of the year.
Do all shared costs have to be distributed to the business units?
No. Deliberate central funding can make sense. The central remainder must, however, remain included in the reconciliation. What matters are the purpose, the nature of the costs and the agreed management rules. In the model shown here, everything is distributed; that is a case assumption and not a general requirement.
Is FinOps the same as IT controlling?
No. FinOps provides working methods for the joint economic management of technology use, particularly for usage-based costs. A bank's IT controlling must in addition map its specific financial, personnel, project and governance links. The FinOps methods in this article complement this task; they do not replace the institution-specific accounting. [1] [3]
Does DORA require a particular IT cost allocation?
The provision used here, Art. 5(2)(g), addresses an appropriate budget for digital operational resilience and its regular review. It prescribes no specific allocation method and no particular software. The article also does not derive any general cost or savings ratio from it. [7]
How does an annual forecast differ from a software business case?
The forecast answers the current expectation for a defined period. A business case compares courses of action, including their assumptions, costs, benefits and risks. A multi-year cost average is therefore not an annual budget. For the investment decision, the article GRC software: calculating the business case transparently explores this perspective in more depth.
Authors, method and sources
How this article came about
Context: The publisher is T-NEX, provider of the Banking Platform described. The article combines publicly available methodological sources with its own, entirely fictional model calculation. It is not a market study, not a product benchmark and not evidence of savings achieved. The podcast passage is reproduced in paraphrase from the transcript. Further information on the editorial work is available under Editorial team.
Source status: 15/16 October 2026. Method descriptions are kept separate from regulatory requirements. The product description was cross-checked against public T-NEX pages and the complete controlling manual dated 25.08.2026. Internal customer information is not part of this article or the downloads.
- FinOps Foundation: Budgeting. Definition and tasks of budgeting; distinction between budget and expected costs. Methodological source, not a legal provision.
- FinOps Foundation: Forecasting. Forecast from past trends and planned changes, including scope, time and prices.
- FinOps Foundation: Allocation. Direct and shared costs, allocation strategy and centrally funded items.
- FinOps Foundation: Managing Shared Cloud Costs. Even as well as fixed and variable proportional allocation as different methods.
- TBM Council: TBM Taxonomy. Version 5.0.1 as maintained on the publisher's page, published on 18.07.2025. Framework for cost pools, resources, solutions and consumers; not an accounting requirement.
- SAP Learning: Event-Based Postings on Internal Orders. Technical documentation on distinguishing statistical information from real account assignments.
- Regulation (EU) 2022/2554, Art. 5(2)(g). Budget for digital operational resilience; official English text at IVASS, PDF page 29.
- T-NEX: AI Controlling Hub. Public product description. Supplementary functional basis: complete controlling manual dated 25.08.2026, in particular pp. 13–14, 41–47, 142–144, 150–153, 178–180 and 184–187. The internal manual is not published as a download because of installation-specific details.
- T-NEX: Banking Platform. Platform context and work areas offered.
- The AI Adoption Podcast mit Andy Price. Economic selection of AI use cases from 21:35, additional context from 08:49. Paraphrase of the transcript; not a verbatim quotation and not a recommendation by T-NEX.
- Bank of America: Beitrag mit Andy Price. The bank's primary evidence for his role at BofA Securities Europe S.A.; not a source for the model calculation.
Case identifier ITK-2026-01 · Version 1.0. The tables and graphics are based on the same published calculation data. The working materials document assumptions and control equations so that individual figures remain traceable in context.