T-NEX Banking Platform
One banking platform for controlling, reporting, compliance, risk, PPM and fraud detection. Shared data model, AI at the core, configurable for your institution.
Learn more
Describe the analysis you need. T-NEX Dynamic AI Reporting creates a dashboard based on your connected data. You can edit charts, check results and share analyses with your team.
From a report to the next question: create analyses, review results and share dashboards with your team.
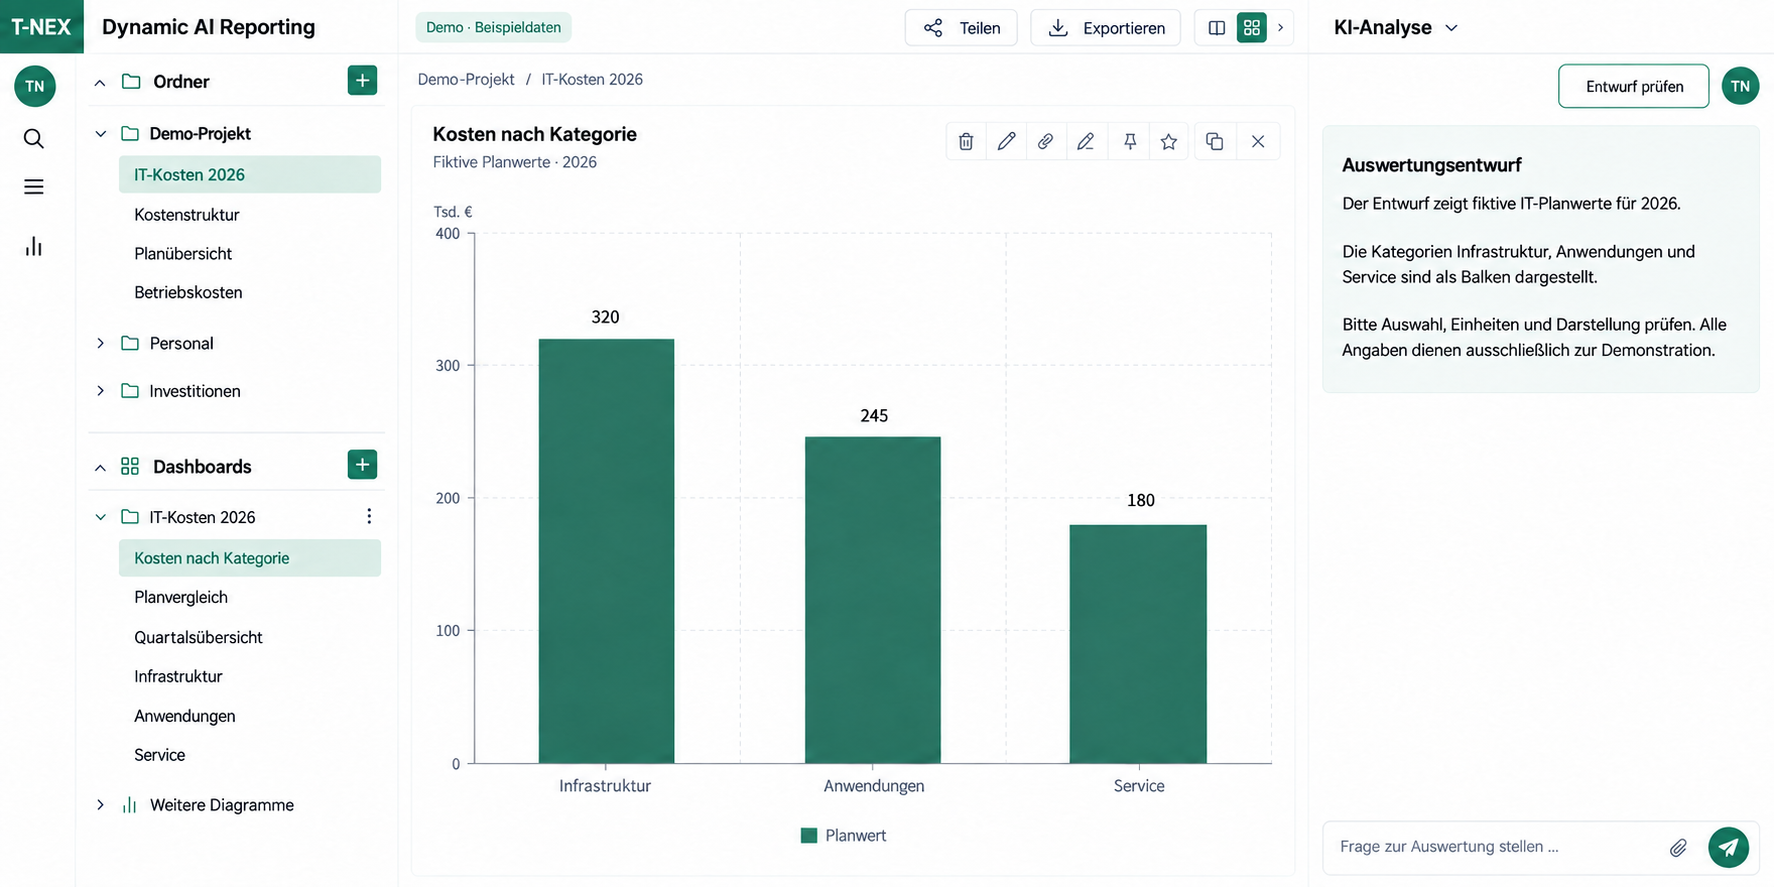
The chart compares IT costs by work area. The accompanying analysis lets you review the figures and their interpretation together.
Review the visualisation and its interpretation side by side.
Enlarge viewThe question defines the period, metric and grouping. The resulting report compares budget and actual figures by work area.
A specific report instead of an open-ended data search.
Show budget and actual figures by work area.
Figures in € thousands.
The detail editor makes the source, dimensions and presentation visible. Check what the report actually compares before using it.
The calculation basis can be checked.
| Setting | Selection |
|---|---|
| Dimension | Work area |
| Measures | Budget / actual |
| Period | Selected quarter |
| Business validation | Still pending |
After business validation, reading and editing rights can be assigned separately. An export brings the report into the next meeting.
A shared report with suitable access rights.
| Role | Permission |
|---|---|
| Report owners | Edit |
| Management team | Read |
| Other roles | No access |
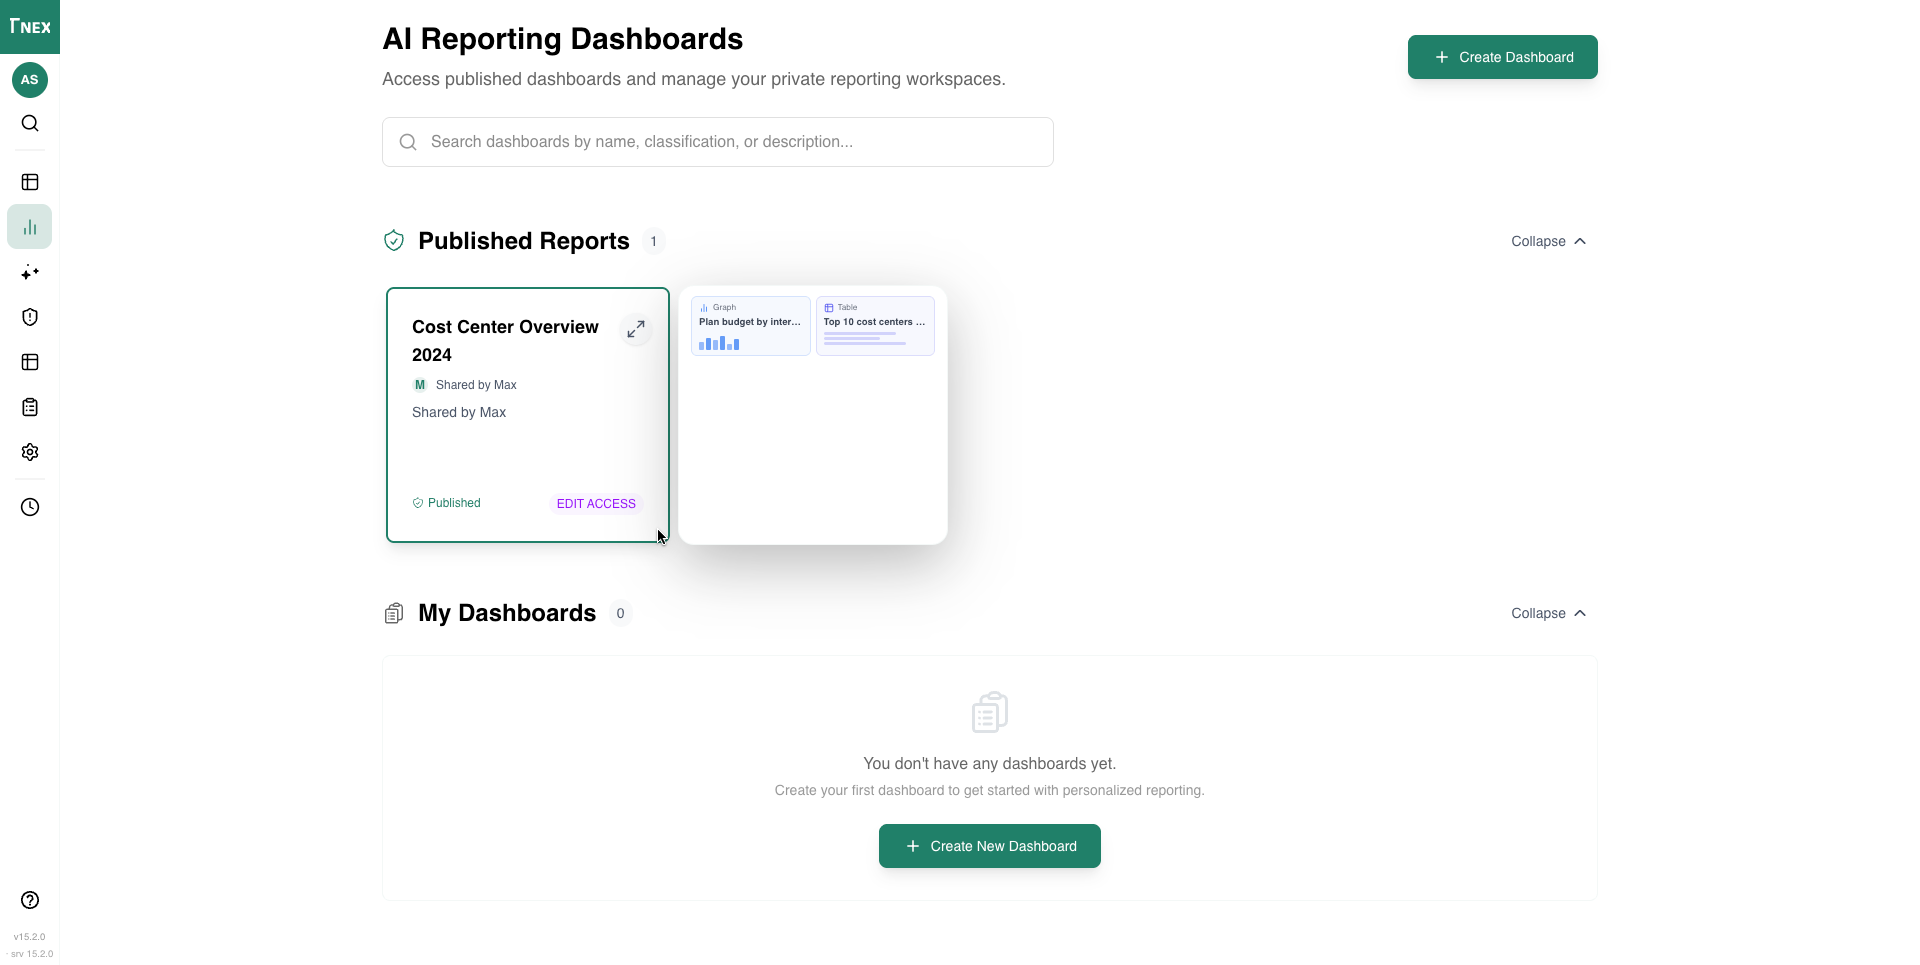
The original view shows published dashboards and the personal reporting area. Existing reports become the starting point for further work.
Recurring reports remain accessible.
 Enlarge view
For IT cost management and business teams that need to create reports and check how their figures were calculated.
T-NEX Dynamic AI Reporting translates a question into reporting logic. The generated application queries the connected data source and presents the result as charts, tables or metrics. Business users can then develop the dashboard further through the conversation or editor.
An initial question might be: “Show the largest budget variances by cost centre for the selected quarter.” A follow-up can narrow the period or add a cost category. The meaning of budget, value type and period must match the underlying data for the report to be meaningful.
A question describes the analysis you need. The resulting dashboard can then be edited.
The editor lets you adjust a chart’s title, data source and dimensions.
Switch between a mixed view, full visualisation, text view and focus view.
Folders group dashboards, while search finds charts by name, classification or description.
Viewing and editing are granted separately. A link can lead directly to an individual chart.
Export individual charts or the whole dashboard for use outside the application.
In the schema-only approach, the model receives structural information and generates the reporting logic. The application accesses the records themselves. Report generation and processing of the underlying data can therefore be designed as separate steps.
AI interpretation of specific amounts or individual records requires a different information scope. We define which content may reach which model for each use case. A schema-only setup does not establish the data behaviour of every analysis function.
The detail editor separates the data side from presentation. You can change titles, data sources, dimensions and display settings; a JSON editor supports advanced changes. Available visualisations include bars, lines, heatmaps, networks, process views, tables and metrics.
A visualisation can be attached as context to the next question. Chart annotations can mark a variance before a review meeting. This keeps the business question next to the analysis it concerns.
Mixed view places the visualisation beside the conversation. Full visualisation view concentrates on charts and tables; text view foregrounds the written analysis. Focus view opens one chart for detailed work.
The presentation should serve the decision: a compact management overview, a table for checking individual entries or an annotated chart for investigating causes. These views provide different ways into the same analysis.
Folders group dashboards by work area, such as cost centres, personnel or investment. Search finds visualisations by name, classification and description. Shared dashboards provide a starting point for recurring questions.
Viewing and editing permissions are granted separately by role. A direct link can lead to one chart. Dashboards and individual visualisations can be exported as images or PDFs for presentations and use outside the application.
We first select a reliable data source and a report with a clear business purpose. Together we define the metrics, dimensions, time basis and control totals. The data connection, roles and permitted model connections are then configured.
Acceptance compares generated analyses with known results. It also covers empty datasets, incomplete sources and ambiguous questions. Only after this comparison is the report made available to further roles, with responsibility for interpretation and approval clearly assigned.
| Connection | Scope and status | Preparation |
|---|---|---|
| Data source | Database and file sources are included in the architecture. The application reads the approved source; the specific connection and refresh are configured. | Schema, fields, period, control totals and a known reference report. |
| AI model | Schema-only creation uses structural information. Content-based analysis needs a separately defined data scope. | Permitted model connection and decisions on processed content. |
| Sharing | Image and PDF export; separate read and edit permissions. | Recipients, roles and required output format. |
Agree the data source and business terminology.
Describe the required analysis as a question.
Check the query and visualisation against the source data.
Edit, share or export the dashboard.
A generated dashboard does not establish that your data is complete or that a business interpretation is correct. Check the data scope and calculation before sharing the result.
Recurring analyses with clear definitions work well, such as budget variances, cost distributions or investment by organisational unit. An existing reference report helps validate the first dashboard.
The architecture supports database and file sources, including data from warehouses, ERP, core banking systems and Excel. We assess and configure the interface, scope and permissions for your source.
Yes. You can edit its title, data source, dimensions and presentation. The conversation and advanced editor provide further ways to refine it.
No. Access depends on the configured function. Schema-only creation uses structural information; permitted content and model connections are defined separately for content-based AI analysis.
Generation does not replace checking the data scope, metric definitions and calculations. We validate reference cases and agree responsibility for business approval.
Within the application, roles receive separate viewing and editing permissions and can use direct chart links. Image and PDF exports support further use.
One banking platform for controlling, reporting, compliance, risk, PPM and fraud detection. Shared data model, AI at the core, configurable for your institution.
Learn more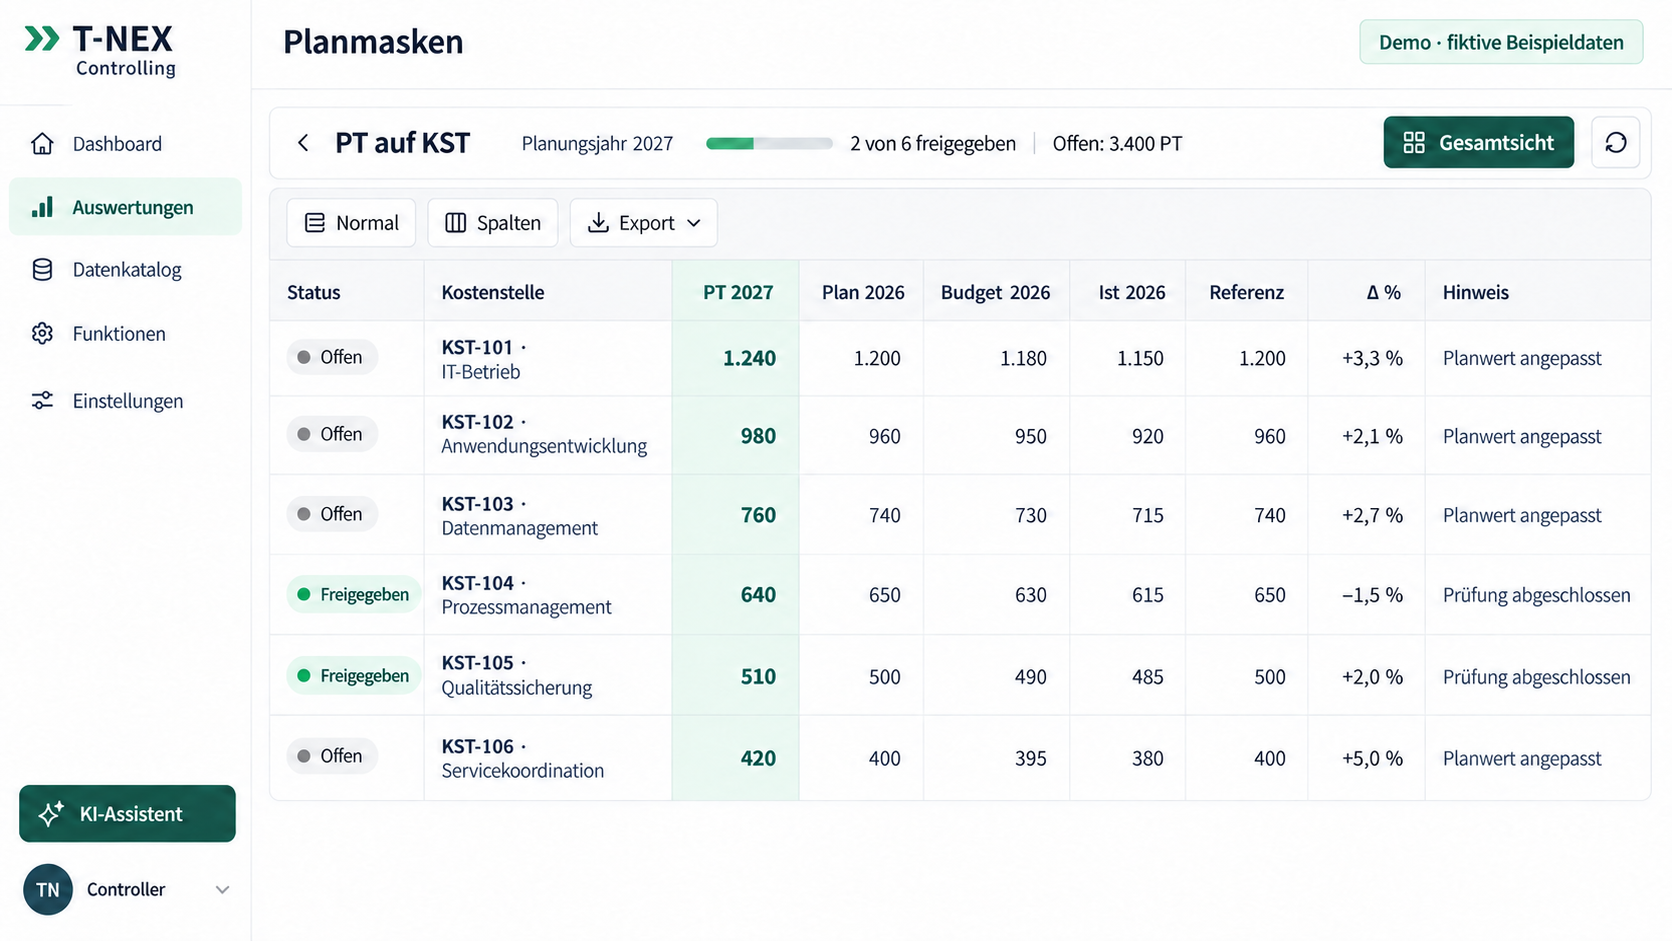
Plan and allocate IT costs. T-NEX Controlling combines imports, planning views and reports with traceable allocation rules.
Learn more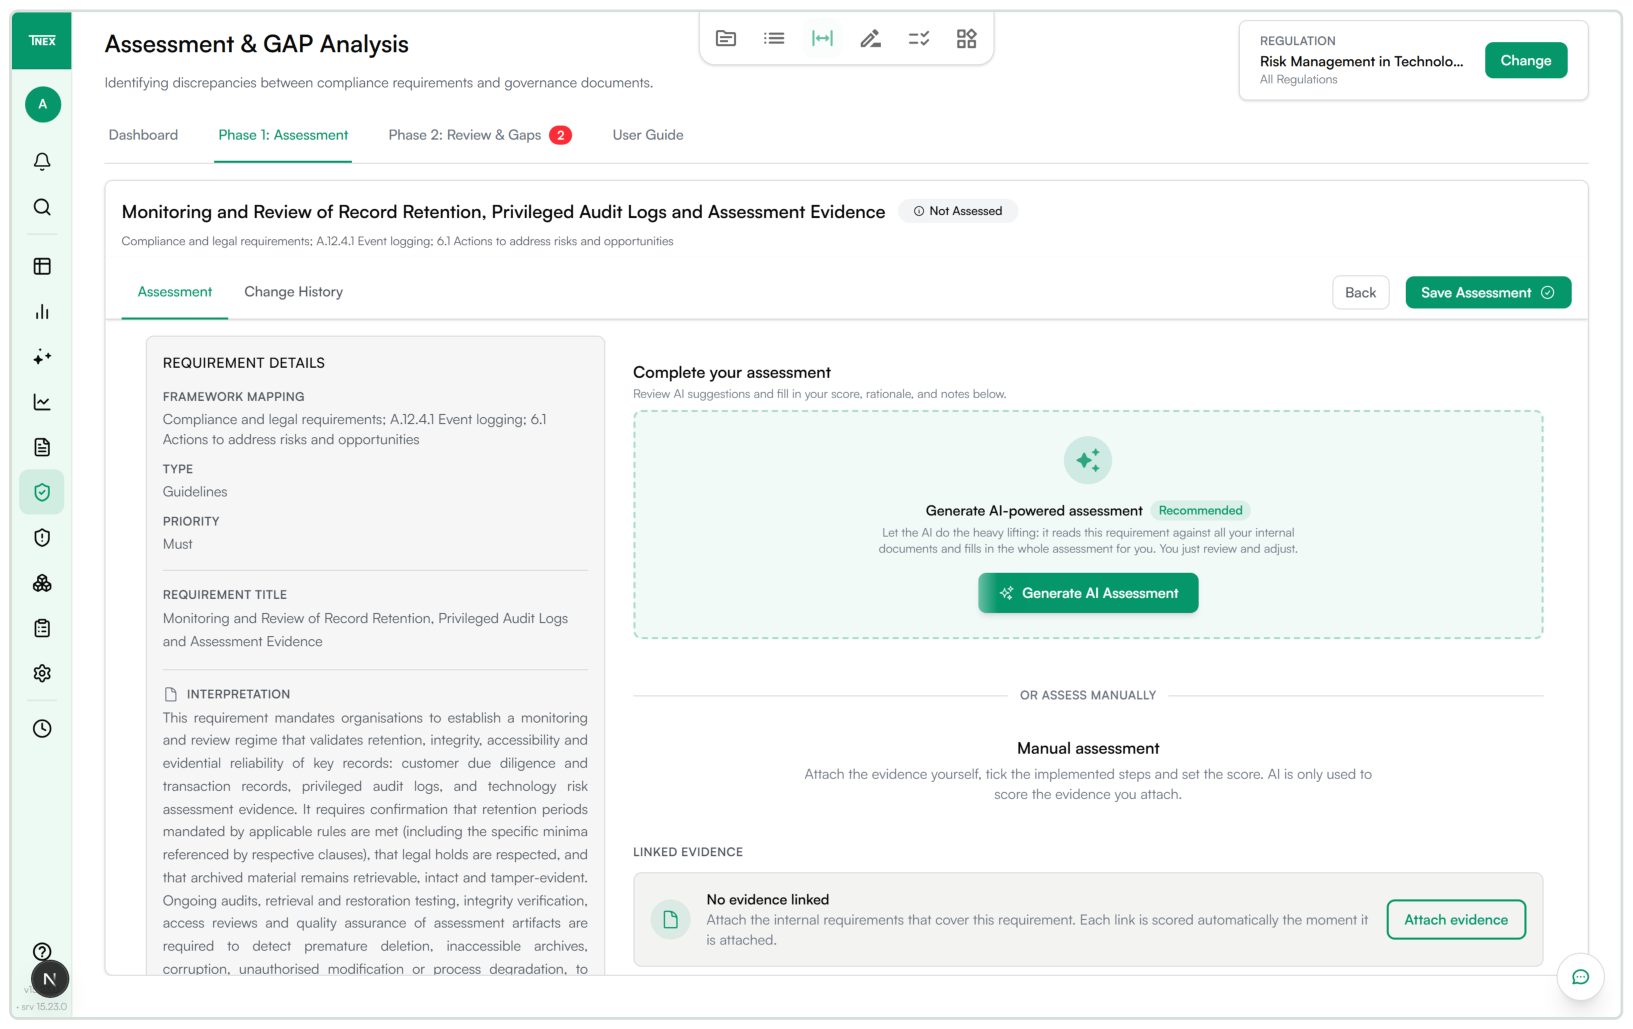
From uploading a regulation to issuing an audit report: T-NEX Compliance connects requirements, assessment, remediation and progress monitoring.
Learn moreBring a concrete task. Together, we will define what the application needs to do.
Discuss reporting for your use case