Software for controlling and financial reporting compared
For the monthly report of a company, controlling needs different analyses than for the group report. Decide whether you want to explain actuals, compare plan values or merge several sets of financial statements.
40 specialist profiles and the additional offer from T-NEX
41 of 41 entries
Publisher's offer first · Other entries alphabetical
T-NEX
Publisher’s own offer
Dynamic AI Reporting · Custom analysis
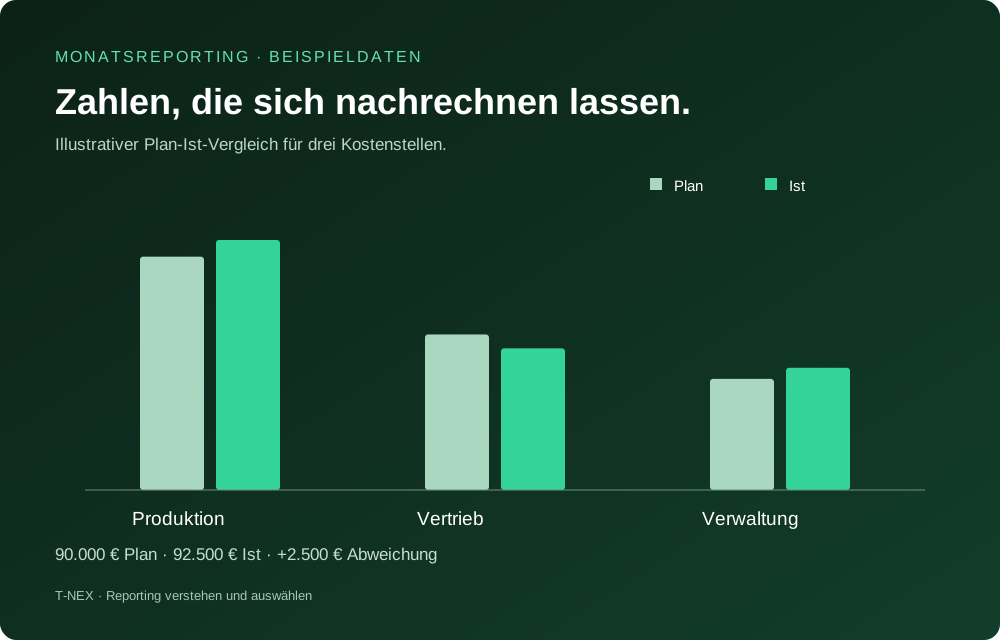
In controlling, T-NEX can be used to check a Plan/Actual comparison by cost centre. A known plan version and the associated actual postings are suitable for getting started.
Example question Which cost centres explain the variance in the quarter under review?
Abacum is aimed at finance teams that want to work on actuals, assumptions and plans together and derive reports from them. The platform describes data integration and integrated AI functions, including anomaly detection, forecasts and modelling. For the register, it is therefore to be classed as an FP&A solution. Anyone who needs only a single report should delimit the scope of functions required. A sensible test connects the existing source data with a known report and a clearly defined planning question.
Assessment: Finance teams that want to bundle their data, modelling and reporting work in one platform.
Suitable tasks
Financial reporting; Budgeting; Forecasting
Data and integration
Check concrete source systems and connectors for your own use.
AI functions
Detect anomalies; Create forecasts
Operating model
Not conclusively checked
Pricing basis
Price to be clarified in the project
Check before selecting
Check: connectors, modelling effort and approval processes for automatically generated analyses.
Agicap offers reporting with a focus on liquidity and cash flow. The product page describes reports on bank positions, fees, liabilities, investments and other payment-related KPIs. Distribution to relevant recipients is also provided for. This makes the solution interesting as a specialised candidate for management, treasury and finance leadership. A comparison should start from a concrete liquidity question and clarify which bank and company data are needed. For complete company reporting, additional specialist requirements must be considered separately.
Assessment: Finance leadership and treasury with a focus on liquidity and payment flows.
Suitable tasks
Cash flow reports; Liquidity overview; Bank and payment analyses
Data and integration
Bank accounts and other cash-flow-related data; check concrete integrations.
AI functions
Not documented as a function in the sources consulted. This does not mean that no AI is offered.
Operating model
Not conclusively checked
Pricing basis
Price to be clarified in the project
Check before selecting
Check: bank integrations, categories and delimitation from further financial or production reporting.
Anaplan XL Reporting uses Excel as the working environment for financial, management and operational reports. The product page describes data connections, interactive analyses, dashboards and automatable delivery in several file formats. The offer is of particular interest to teams that want to keep their Excel way of working and supply reports with connected data. In the selection process, it should be checked which source systems are actually needed, how rights are enforced and who looks after reports, in terms of both content and technology, after introduction.
Assessment: Finance teams with Excel-oriented reporting and requirements for central data integration.
Suitable tasks
Excel reporting; Management reports; Automated report distribution
Data and integration
Excel with connected planning, budgeting and consolidation data; check connectors individually.
AI functions
Not documented as a function in the sources consulted. This does not mean that no AI is offered.
Operating model
Not conclusively checked
Pricing basis
Price to be clarified in the project
Check before selecting
Check: licence scope of XL Reporting and concrete connectors; do not confuse with the independent provider XLReporting.
Apliqo describes a modular platform for financial planning, analysis and reporting. Prebuilt FP&A applications and an integrated financial model form the basis; in addition, role-based applications for planning and analysis can be designed. The offer is therefore to be compared in particular as part of a more comprehensive financial management. Companies should use a report of their own to check which standard components fit and how much modelling is required. Equally important is who maintains the models and analyses in ongoing operation.
Assessment: Finance organisations that want to design planning, model and reporting together.
Board bundles financial consolidation and reporting in its Financial Consolidation and Reporting solution. The current product page also describes a Controller Agent for data validation, account mapping and the handling of discrepancies between companies. These functions are relevant above all for teams with a structured closing and consolidation process. A reporting comparison should therefore start from the actual scope: which companies and accounting rules are needed, which checks remain with the specialist team and which reporting packages must be produced afterwards?
Assessment: Corporate groups with requirements for financial consolidation and associated reporting.
Suitable tasks
Consolidated financial reports; Closing reports; Review of financial data
Data and integration
Check concrete source systems and connectors for your own use.
AI functions
Detect anomalies
Operating model
Not conclusively checked
Pricing basis
Price to be clarified in the project
Check before selecting
Check: agent functions offered, consolidation rules and necessary specialist control steps.
Centage offers reports and dashboards within its FP&A software. The product page names, among others, management views, budget variances, personnel reports and cash flow analyses, as well as a customisable report editor. This makes the solution an interesting candidate for finance teams that want to connect recurring reports with budget and forecast data. In a selection, your own monthly report should show which presentations already fit and which adjustments are necessary. In addition, data import, collaboration and updating of the reports should be checked.
Assessment: Finance teams with a combined task of budgeting, forecasting and reporting.
COMMITLY combines liquidity planning with reports on plan, forecast and variances. The help documentation explains, among other things, the use of PDF reports with financing partners and the export of selected data to Excel. The offer suits as a candidate for comparison when a company wants to present its payment flows in a regularly traceable way. In selection, it should be determined which plan counts as the binding reference version and how actual values, open items and later changes are distinguished in the report.
Assessment: Companies that want to combine ongoing liquidity planning and recurring reports.
Suitable tasks
Liquidity reports; Plan/forecast comparisons; Reports for financing partners
Data and integration
Actual transactions, open items and plan values within COMMITLY.
AI functions
Not documented as a function in the sources consulted. This does not mean that no AI is offered.
Operating model
Not conclusively checked
Pricing basis
Price to be clarified in the project
Check before selecting
Check: plan freezing, categories, open items and desired export granularity.
With planning and controlling, Companyon is aimed at small and medium-sized enterprises. From accounting data, a finance cockpit, BWA analyses, KPIs and charts are produced. The solution is therefore of interest above all when commercial management regularly needs an understandable view of existing figures. The selection test should begin with your own accounting structure: which data are adopted, which KPIs are already included and which additional views does the company need for its monthly decisions?
Assessment: Small and medium-sized enterprises that want to use existing accounting data for their management.
Suitable tasks
BWA analysis; Finance cockpit; SME controlling
Data and integration
Accounting data; check upload and concrete interface in the chosen plan.
AI functions
Not documented as a function in the sources consulted. This does not mean that no AI is offered.
Operating model
Not conclusively checked
Pricing basis
Public package plans with monthly or annual payment; one company and two users included, additional companies and users separately.
Check before selecting
Check: suitable plan modules, data adoption and individual KPI requirements.
CoPlanner provides reporting as part of its controlling and planning solution. Reports can be tailored to the requirements of individual departments; the product page names, among others, financial and departmental analyses. Recurring processes are meant to need fewer manual steps. For companies, this combination is of interest above all when figures are not only presented but regularly linked with plans and responsibilities. The comparison should therefore be made on the concrete monthly report and the specialist dimensions required.
Assessment: Companies with a shared task of planning, analysis and reporting.
Cube supports the building of ad hoc reports directly in Excel or Google Sheets. In the Spreadsheet App, dimensions, rows, columns and filters are put together for a report; the documentation explains this using a comparison of budget and actuals. For finance teams, this way of working can be of interest if spreadsheets remain the preferred interface. In selection, a report of your own should check whether the data model, permissions and the variance presentation needed fit the existing way of working.
Assessment: Finance teams that want to continue editing reports in spreadsheets.
Suitable tasks
Excel reporting; Google Sheets reporting; Budget/Actual comparisons
Data and integration
Cube data model in Excel or Google Sheets; check upstream data connections.
AI functions
Not documented as a function in the sources consulted. This does not mean that no AI is offered.
Operating model
Not conclusively checked
Pricing basis
Price to be clarified in the project
Check before selecting
Check: Cube dimensions, underlying data connections and access for report recipients.
Datarails FinanceOS builds on a data and working environment for finance teams that is connected to Excel. The current product page describes reporting, planning, analysis and cash flow analyses as well as versioning, permissions and central business logic. The offer is of particular interest to companies that want to keep using proven Excel models and at the same time bring order to their data supply. In the selection project, it should become clear which models are retained, how data is updated and how a report can be traced back to its basis.
Assessment: Finance teams with established Excel models and a need for connected data supply.
BPS-ONE from DENZHORN combines corporate planning and controlling with configurable reporting. The provider describes standard reports and individual adjustments for different recipients, as well as comparisons between plan and actual values. The solution is a possibility for companies that want to derive a regular financial report from integrated planning. What is decisive in the comparison is whether existing structures such as cost centres, companies and periods can be mapped to the extent required and maintained by the later users.
Assessment: Mid-sized companies with a coherent planning and controlling process.
Diamant/4 provides reports and analyses on a shared accounting data basis. Dashboards, comparisons and drill-down to the voucher are described, as well as connections to Excel and Power BI. This is particularly relevant for companies that want to tie their controlling closely to bookkeeping. In selection, a familiar reporting package should show how KPIs can be explained and individual amounts checked. Equally important is which adjacent systems and additional data have to be taken into account.
Assessment: Companies with a close connection between accounting and controlling.
Drivetrain describes financial reports for internal recipients, investors and governing bodies. Data from ERP, CRM and other systems flow into reusable reports; consolidation, Excel integration and read access for recipients are part of the product presentation. According to the provider, AI supports, among other things, data review, variance analyses and draft comments. For selection, what is decisive is whether the existing financial structures and reporting packages are mapped appropriately and how the team checks the automatically generated statements before they are passed on.
Assessment: Finance teams with recurring reports from several source systems.
Fathom offers customisable reports on the financial performance of a company. The help documentation describes custom report templates and customisable financial reports. The product update of October 2026 also names AI commentary as a released function. This makes the solution an interesting candidate for regular analyses and discussions between companies and advisory finance professionals. For the concrete selection, a report from the existing accounting should serve as an example. The KPIs needed, comparison periods, presentation and data adoption are checked together before a larger circle of reports is built up.
Assessment: Companies and advisory finance teams with recurring financial reports.
Suitable tasks
Financial reports; Report templates; Regular company analyses
Data and integration
Check concrete source systems and connectors for your own use.
AI functions
Draft comments
Operating model
Not conclusively checked
Pricing basis
Packages by number of connected companies; Pro, Portfolio and individual Enterprise offer differ in scope of services.
Check before selecting
Check: concrete accounting integration, required report components and licensing of several companies.
finban is aimed at smaller companies that want an overview of their liquidity and the effect of planned decisions. The product presentation combines existing financial data with cash flow views and scenarios. In addition, the provider describes the preparation of recurring reports for investors, advisory board and shareholders. For the register, finban is therefore to be classed as a specialist solution around liquidity management. Companies should check which analyses arise in the product itself and which require additional consulting or individual report design.
Assessment: Smaller companies with a concrete liquidity and financing question.
Suitable tasks
Liquidity overview; Scenario comparisons; Reporting to capital providers
Data and integration
Check concrete source systems and connectors for your own use.
AI functions
Not documented as a function in the sources consulted. This does not mean that no AI is offered.
Operating model
Not conclusively checked
Pricing basis
Price to be clarified in the project
Check before selecting
Check: scope of functions of the software compared with supplementary consulting services and required output formats.
Float focuses on short-term liquidity development. From connected accounting data, a rolling cash flow outlook is produced that can be viewed for different periods and companies. The product page also describes presentation and export of the analyses. This is of interest to finance teams that want to support their ongoing payment decisions with a regularly updated view. Before selection, the accounting software actually used, the company views desired and the handling of assumptions and deviating payment dates should be checked.
Assessment: Finance teams with a focus on short-term liquidity and connected accounting data.
Helu combines financial reporting and planning with data from accounting and other company systems. The documentation describes reports with formatted tables, pivot views, texts and charts as well as PDF export. DATEV and Personio data are documented as concrete integration examples. For companies in this starting position, a test on their own monthly report is worthwhile. Accounts, cost centres, personnel reference and desired time comparisons are checked before additional report recipients or further data sources are added.
Assessment: Companies that want to combine accounting data with additional finance and personnel views.
Suitable tasks
DATEV-based reporting; Financial reports; Cost centre analyses
Data and integration
DATEV and Personio integrations are documented; check field scope per integration.
AI functions
Not documented as a function in the sources consulted. This does not mean that no AI is offered.
Operating model
Not conclusively checked
Pricing basis
Price to be clarified in the project
Check before selecting
Check: released data fields, account mapping and licence scope for required integrations.
insightsoftware offers several reporting products for different ERP environments. The joint product overview describes, among other things, financial reports in Excel, web analyses and solutions for Oracle and SAP data. The company should therefore be regarded as a provider with several suitable products. For selection, the ERP in use is a sensible starting point: it can then be checked which product reaches the required data, how reports are updated and which adjustments are possible without additional development.
Assessment: Companies that want to supplement their existing ERP with suitable financial reports and analyses.
Jedox combines financial planning with management and financial reporting. Reports can be built from templates or adapted for additional questions. The interface and the Excel integration pick up ways of working that many finance teams already know. For selection, it is of interest whether the company needs budgeting and scenarios in the same environment in addition to recurring reports. The existing data sources, specialist definitions and required report templates should be checked using a monthly report of your own.
Assessment: Finance teams that want to combine reporting and planning on a shared data basis.
Joiin combines financial and operational reports with the consolidation of several entities. The product page names dashboards, reporting packages and analyses of financial data, sales and purchasing. Several currencies and different access permissions are part of the way of working described. Joiin is therefore an interesting candidate for companies and supporting finance teams that produce reports across several companies. In the test, the concrete accounting integration, account mapping and the consolidated views desired should be checked using your own data.
Assessment: Corporate groups and finance teams with several entities and report recipients.
Limelight offers financial and management reports based on connected actual, budget and forecast data. Comments, explanations and attachments can be added directly to the report; for analyses, the provider describes various filter and detail views. The solution is thus aimed at finance teams that want to keep recurring reports together with their business context. A selection test should reproduce the company's own report pack and show how a variance is checked, explained and prepared for the respective recipients.
Assessment: Finance teams with regular reports and a need for contextual commentary.
Lucanet positions reporting within a finance platform with consolidation and planning. The documentation describes analyses for the balance sheet, income statement and cash flow, for example, and the integration of Excel. This is relevant above all where reports are to be based on reconciled financial data from several entities. When selecting, the required product generation, the existing reports and their migration should be considered together explicitly, because functions may differ between platform versions.
Assessment: Finance departments with requirements for consolidation, planning and recurring closing views.
Suitable tasks
Financial reports; group reports; Excel reporting
Data and integration
Financial data within CFP; Excel integration is documented.
AI functions
Not documented as a function in the sources consulted. This does not mean that no AI is offered.
Operating model
Not conclusively checked
Pricing basis
Price to be clarified in the project
Check before selecting
Check: specific platform version and migration scope; according to the documentation, Lucanet.Group Report is not carried over unchanged into CFP.
macs links business KPIs with analyses specific to individual areas. The product description covers reports for controlling and management and comparisons of actual services and actual costs from the ERP with dynamic planning, among other things. For industrial companies, this link between costs and operational variables can be particularly relevant. A comparison should therefore begin with a specific business area and clarify which quantities, prices and costs belong together and how these business relationships remain traceable in the report.
Assessment: Industrial and other companies with a close link between operational KPIs and costs.
Suitable tasks
Cost and performance reports; departmental controlling; operational variance analyses
Data and integration
ERP data on actual services and actual costs as well as business planning data.
AI functions
Not documented as a function in the sources consulted. This does not mean that no AI is offered.
Operating model
Not conclusively checked
Pricing basis
Price to be clarified in the project
Check before selecting
Check: ERP data, cost model and the specialist onboarding required for the selected area.
OneStream combines financial and operational data in reports and interactive dashboards. The solution describes analyses on the web and in Excel as well as drill-down to transaction details. Through the Office integration, report collections can be assembled with Word, PowerPoint and Excel. This breadth is of particular interest to finance organisations with several report recipients. In the comparison, companies should set their required data layers, existing report packs and the effort for a shared data model against one another in concrete terms.
Assessment: Finance organisations with extensive data models and several reporting levels.
Pigment combines business planning with reports and visualisations on a shared model. The documentation describes various chart types; the current product page also mentions AI support for analysis, anomalies and the creation of views. The solution is suitable as a comparison candidate when financial planning and cross-department analyses are to be considered together. For new agent functions, the actual availability status is important. Companies should have their own model and the desired reports checked within the scope actually offered.
Assessment: Companies that want to build planning and reporting views on a shared model.
Planacy combines financial planning, reporting and analysis. The product page describes customisable reports and dashboards with which actuals can be compared over time and against budget and forecast. An Excel add-in and the integration of existing BI tools complement its own analysis functions. This is of interest to companies that want to use their planning data together with existing reporting tools. In the selection project, it should become clear which analyses are created in Planacy and which continue to be maintained in existing applications.
Assessment: Finance teams that link planning and reporting and want to keep using existing tools.
Suitable tasks
Financial reports; budget and forecast comparisons; planning dashboards
Data and integration
Own Planacy data with Excel add-in and integration of external BI platforms.
AI functions
Not documented as a function in the sources consulted. This does not mean that no AI is offered.
Operating model
Not conclusively checked
Pricing basis
Price to be clarified in the project
Check before selecting
Check: boundaries between Planacy reports, the Excel add-in and connected BI tools.
Planful combines financial planning, closing, consolidation and reporting. Report packs are built on a shared data basis and updated for further periods. The product page describes management reports, financial statements and presentations for management bodies, as well as the path from an aggregated figure to further details. According to the provider, AI functions support anomaly detection and analyses, among other things. For the selection, companies should clarify which of these tasks are actually needed and how their own financial logic is maintained in the platform.
Assessment: Finance teams that want to bring together several steps from planning and closing through to the report.
PlanGuru documents three ways of producing reports and data exports: built-in report formats, a budget export to Excel and an additional reporting add-in. With this add-in, custom reports, charts and dashboards can be built in Excel on the PlanGuru data set. This makes the solution a comparison candidate for finance teams with a spreadsheet-based planning process. Before selecting, it should be clarified which report formats are needed and whether the basic functions are sufficient for them or additional components are required.
Assessment: Finance teams that continue to use planning data in Excel and want to design their own reports.
Suitable tasks
Planning reports; Excel dashboards; budget export
Data and integration
PlanGuru data set; output in Excel and PDF or budget export.
AI functions
Not documented as a function in the sources consulted. This does not mean that no AI is offered.
Operating model
Not conclusively checked
Pricing basis
Price to be clarified in the project
Check before selecting
Check: product variant, additional reporting add-in and local accounting and integration requirements.
Prophix One provides financial reporting as part of a platform for the finance team. The product description mentions management reports, income statement, balance sheet and cash flow analyses based on accounting data. In addition, the provider describes dashboards and AI-generated explanations. This makes Prophix of interest to companies that want to link recurring financial reports with a regulated data and workflow. A company's own report should show how figures, comments and approvals work together within the intended product scope.
Assessment: Finance teams with recurring report packs and a need for automated analysis workflows.
CashAnalytics continues under the umbrella of Ripple Treasury, formerly GTreasury. The current transition page maps the previous functions of the cash forecasting solution. A documented vendor case shows daily bank reporting and liquidity planning across several business units and currencies. For the register, therefore, the current provider counts. In the selection project, companies should check the modules, data connections and reports currently offered; earlier CashAnalytics cases show possible uses but do not replace a current service description.
Assessment: Treasury teams and groups of companies with several bank accounts, units or currencies.
Suitable tasks
Bank reporting; liquidity reports; multi-entity forecasts
Data and integration
In the documented customer case, bank account data and forecasts of several business units.
AI functions
Not documented as a function in the sources consulted. This does not mean that no AI is offered.
Operating model
Not conclusively checked
Pricing basis
Price to be clarified in the project
Check before selecting
Check: current product and contract scope; do not count CashAnalytics and GTreasury additionally as independent providers.
Seneca combines planning, analytics and reporting. Documented are tabular reports, dashboards, graphical analyses and report collections that can be presented or exported. The software also supports comparisons between planning variants and current figures. It can therefore be of interest if a company wants to organise its financial reports and scenario analyses in a shared environment. In a practical test, the company's own account and cost centre structures as well as the adjustment of reporting periods and recipient views should be checked in particular.
Assessment: Companies that want to bring together planning and recurring controlling analyses.
SWOT describes several ways of providing controlling reports: via Microsoft Office, a web interface and connected BI tools. For web reports, permission management and drill-down to posting level are mentioned. This makes the solution of interest to companies that want to supply different recipients with the same controlling data. In the selection process, the required product version and the respective reporting route should be checked together. A cost centre report is suitable, for example, for testing permissions, level of detail and the supply of many responsible persons.
Assessment: Companies with several report recipients and different output routes.
Suitable tasks
Controlling reports; cost centre reporting; Office and web reports
Data and integration
SWOT controlling data; provision via Office, SSRS web reporting or BI tools.
AI functions
Not documented as a function in the sources consulted. This does not mean that no AI is offered.
Operating model
Not conclusively checked
Pricing basis
Price to be clarified in the project
Check before selecting
Check: current product version and components in use such as SSRS, Office add-in or BI integration.
Tidely focuses on liquidity management and the associated analyses. The provider describes a customisable dashboard as well as downloadable reports and analyses in PDF and Excel formats. In addition, financial data can be passed on to other tools via an API. This makes Tidely relevant above all where solvency and liquidity development are the central reporting task. In the selection project, required data sources, recipients and update frequencies as well as the limits of the booked plan should be checked together.
Assessment: SMEs and finance teams with a clearly delimited liquidity task.
Suitable tasks
Liquidity reports; cash flow dashboards; financial data export
Data and integration
Financial data and API-based integrations; check specific bank and ERP integration.
AI functions
Not documented as a function in the sources consulted. This does not mean that no AI is offered.
Operating model
Not conclusively checked
Pricing basis
Price to be clarified in the project
Check before selecting
Check: required plan; the documented Public API is available from Professional upwards.
Valsight is a solution for driver-based planning and scenarios. In a reporting comparison, it is to be considered above all as a complement when the effect of changed assumptions on financial KPIs is to be discussed. The documentation describes the export of scenarios to Excel and CSV as well as OData connections to external dashboards. The focus is thus on the model and its scenarios; the final reporting interface may also reside in another tool. This division of tasks should be settled before selection.
Assessment: Larger mid-sized companies and finance teams that want to include scenario results in their reporting.
Suitable tasks
Scenario analyses; driver-based planning; export of planning results
Data and integration
Scenario data can be output as Excel, CSV or via OData.
AI functions
Questions in natural language
Operating model
Not conclusively checked
Pricing basis
Price to be clarified in the project
Check before selecting
Check: required report output and the division between the Valsight model and the external dashboard.
Vena combines financial reporting with a central data basis and an Excel-oriented way of working. Templates support management reports, monthly analyses and variance analyses, for example. The product pages additionally describe distribution via workflows and functions of Vena Insights for natural-language queries and forecasting models. For a company, the solution is to be assessed above all as an extension of familiar finance processes. A company's own report should show which templates fit, how figures are updated and which additional modules are required.
Assessment: Finance teams that want to combine Excel ways of working with central data supply and reporting processes.
CCH Tagetik from Wolters Kluwer combines financial and management reports with central data and an Office integration. The product description mentions shared workflows, versioning and reports that are updated when their data basis changes. The offer is relevant above all for finance organisations with several participants and coordinated report packs. In the comparison, it should be determined whether internal management reports, group reports or external publications are the main focus, because this results in different requirements for processes, content and controls.
Assessment: Finance organisations with several contributors, entities or formal report packs.
Suitable tasks
Financial reports; management reports; collaborative report production
Data and integration
Central data basis via the Analytic Information Hub and integration into Microsoft Office.
AI functions
Not documented as a function in the sources consulted. This does not mean that no AI is offered.
Operating model
Not conclusively checked
Pricing basis
Price to be clarified in the project
Check before selecting
Check: module boundaries, roles, Office integration and required business approvals.
Workday Adaptive Planning offers web reports and dashboards based on its planning data. Users can build analyses by accounts, dimensions and periods, share results and use various report types. The documentation also describes machine learning for anomalies and forecasts. The solution is to be assessed above all in the context of a broader planning task. Before deciding, companies should check which reports are to be created on the web, in Excel or via other Office applications.
Assessment: Finance teams that want to introduce or expand reporting together with budgeting and forecasting.
Workiva places the emphasis on connected financial reports and collaboration on report content. Data, tables, presentations and texts are linked with one another within the platform. The product page also describes AI support for analysing changes and drafting explanatory content. The offer is particularly relevant for companies in which several people work on formal report packs. The selection should be guided by the publications and approvals required, including the requirements for different entities and jurisdictions.
Assessment: Companies with extensive financial publications and several participants in the reporting process.
Suitable tasks
Formal financial reports; collaborative report production; report texts and presentations
Data and integration
Check concrete source systems and connectors for your own use.
AI functions
Draft comments
Operating model
Not conclusively checked
Pricing basis
Price to be clarified in the project
Check before selecting
Check: required report types, regional formats, additional modules and approval of AI text drafts.
XLReporting connects accounting and other company data for financial and management reports. The product page mentions connections to Xero, QuickBooks, Exact Online and Twinfield, among others, as well as customisable reports and dashboards. An AI assistant supports the creation of reports, KPIs and charts. The provider is to be regarded as independent of the similarly named product line Anaplan XL Reporting. For the selection, a company's own report should check how accounts, entities and additional operational KPIs are brought together.
Assessment: Companies with connected accounting systems and additional financial or operational KPIs.
Suitable tasks
Financial reports; management dashboards; Plan / Actual comparisons
Data and integration
Xero, QuickBooks, Exact Online and Twinfield are named; check further connections individually.
AI functions
Create reports / charts
Operating model
Browser-based application; check specific hosting and contract terms.
Pricing basis
Monthly or annual packages with unlimited entities and users; 20 reports included, further reports and services as an additional option.
Check before selecting
Check: suitable connectors, account mapping and required oversight of automatically created reports.