
T-NEX provider register
Bring together ERP and manufacturing data for production reporting
Manufacturing reports an order as finished, but a partial quantity is still open in the ERP. For plant management and controlling to see the same order status, confirmations, postings and dates have to match in the report.
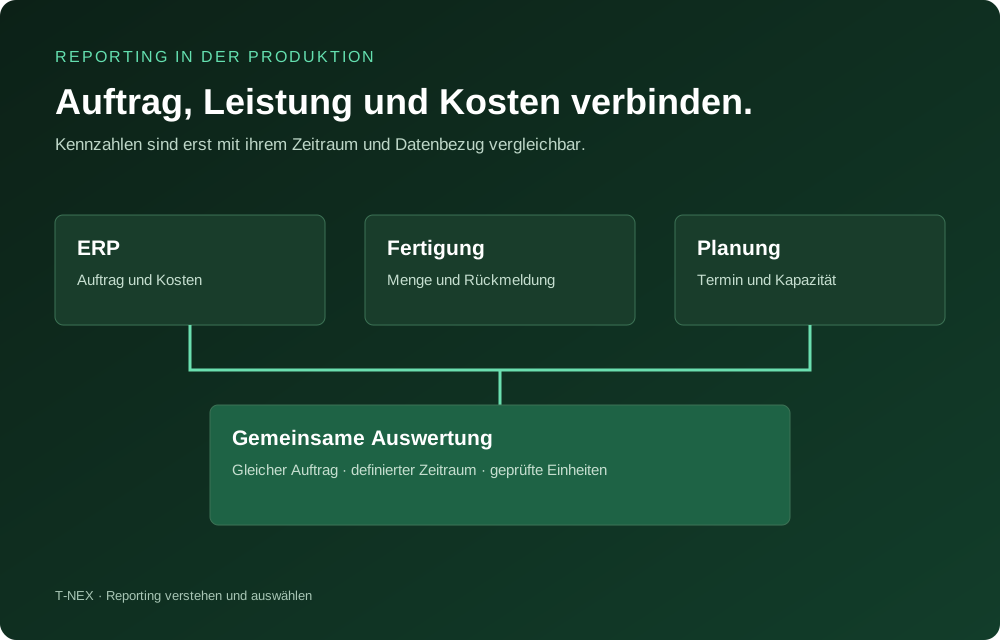
Which decision should the production report support?
Production reporting prepares data from manufacturing and adjacent areas for a specific decision. For the daily coordination, open orders and missing confirmations may be important. For the monthly discussion with commercial management, quantities, schedule variances and costs may be the focus. Different reports result from this.
First formulate a question that has to be answered regularly. For example: “Which orders with a committed date this week have not yet been fully reported as finished?” Add who derives which action from the result. A report without a named recipient easily accumulates more KPIs than are needed in daily work.
Deliberately limit the first deployment: one order type, one site or one manufacturing area. The professional rules can later be transferred to other areas. Whether this is possible without adjustment has to be checked against the processes there.
Which data comes from which system?
| Information required | Possible source | Professional clarification |
|---|---|---|
| Order number, item, target quantity and date | ERP or order management | Which date is authoritative and which change status applies? |
| Good quantity, scrap and operation | MES, shop-floor data collection or confirmation file | What is counted per operation and when does the quantity count as finished? |
| Machine status or process value | Machine data collection or suitable data interface | Which time reference and which unit belong to the value? |
| Material and service costs | ERP, cost accounting or approved costing | Are these planned costs, posted actual costs or still provisional costs? |
| Quality release | Quality system or documented inspection process | When may a technically manufactured quantity count as released? |
The table is a suggestion for taking stock. In your operation, several pieces of information may already be held in one system. Check the existing export and analysis options before building up additional data collection.
For each source, write down the person responsible, the refresh frequency and the expected quality. For a management discussion, a daily status may be enough. For an immediate operational response, the required timeliness has to be specified separately.
Sample case: when does an order count as on time?
The following example is invented and serves for professional delimitation. An order comprises 100 pieces. By the committed date, 80 pieces have been reported as good and fully completed. A further 20 pieces are completed the following day. The operation has to decide which statement the report should deliver.
An order-based KPI can show the order as not fully on time. A quantity-based KPI can show a good quantity of 80 per cent completed by the date. Both statements are arithmetically traceable, but they answer different questions. The report must name the chosen definition clearly.
Also check what counts as the date: the originally committed time, a later confirmed date or an internal planned date. If changes are overwritten, historical on-time performance may no longer be derivable from the current data status. For such an analysis, the required history must be provided for.
The sample case shows why a new chart alone does not create a uniform KPI. Production, sales and controlling should use the same definition when they talk about the same result.
How orders and confirmations come together correctly
A reporting integration needs a reliable link between the data. An order number alone can be too little if items, sub-orders or operations are held separately. Define which keys make a record unique and how cancellations and corrections are handled.
A constellation that often needs checking arises when an order has several confirmations. If its full order costs are assigned to each confirmation row and then summed, double counting can occur. The merging must match the level at which the KPI is calculated.
For your test, therefore, use at least one order with several operations, one partial completion confirmation and one corrected confirmation. Compare the individual values and the total with the leading system. This shows whether the report creates an additional view or links the source data incorrectly.
An existing interface standard can support the technical connection. The OPC Foundation describes, for example, information models for manufacturing resources in the ISA-95 context. Which objects and attributes your systems actually provide still has to be checked specifically.
ERP analysis, MES analysis or complementary dashboard?
If the required report arises entirely from the ERP, first check its existing analysis functions. If machine or process data is the focus, the analysis in the manufacturing system in use can be the suitable starting point. A complementary reporting solution becomes interesting if several views are to be brought together or special operating flows are to be supported.
A manufacturer example of a manufacturing-specific analysis is MPDV Production Process Analysis. The product page describes tabular and graphical analyses of historical process data. Such offers should be assessed by the scope required and their integration into the existing environment.
By displaying production data, a reporting application does not automatically take on the tasks of manufacturing control. Define whether the deployment evaluates in a read-only way or intervenes in operational processes. For a first report this boundary is particularly helpful, because integration and acceptance can then be described more clearly.
The register for ERP and production reporting classifies suitable offers. Compare the specific report and the existing sources, not just the number of functions listed.
Which cases belong in an acceptance test
For a production report, expected results should be known before the test. Use a closed period and keep the authoritative source data. The following cases help to check the professional mapping:
- An order is completed in full and on time.
- An order consists of several operations and partial confirmations.
- A confirmation is cancelled or corrected retrospectively.
- Good quantity and scrap are reported separately.
- A committed date changes after the original planning.
- A data source delivers late or remains empty.
- A cost value is still provisional and is posted as final later.
- Two sites use the same identifier for different objects.
For each case, add the desired presentation and the behaviour in the event of a gap. A missing value, for example, should not be treated as zero without a professional definition. For comparison periods, it must remain recognisable whether the data basis has changed.
Also check the view of the later recipients. Production management and controlling must be able to explain the meaning of the KPI in the same way. If that succeeds only with the developer’s help, an understandable definition or presentation is usually still missing.
Where AI can sensibly complement production reporting
A natural-language query can make access to a prepared data set easier. For this, terms such as order, finished, blocked or on time must be unambiguously mapped. A question about “problematic orders” is too open without this definition.
Begin with a clear query, for example about orders with a certain date and a still open quantity. Check filters, timeliness and calculation against a known case. Only after that should further questions or written comments be added.
An automatic cause for scrap, downtime or schedule delay cannot be derived from a KPI overview alone. This would require suitable additional data and a verified analysis method. In the offer, therefore, separate pure analysis from diagnostic or forecasting functions.
For T-NEX, the specific reporting case is the basis for discussion. Which data integration and analysis are implemented is determined jointly. The guide Assessing AI reporting describes the matching test questions.
What you can prepare for a first production report
Bring together an existing report, the definition of the most important KPIs and an overview of the data sources. Add a typical order and a difficult exceptional case. This allows the scope to be determined far better than with a general demand for a production dashboard.
Together with production, controlling and IT, define who is responsible for the source, who defines the KPI and who accepts the result. A change to an operation or a type of confirmation can later affect the report. This route for changes therefore belongs in the planning from the start.
Assess success against the chosen task: Is the report available on time? Are open points recognisable? Can queries be traced back to the source? How much ongoing maintenance is needed? The cost overview supports the economic assessment.
Frequently asked questions
Do we need a new MES for production reporting?
This can be derived only from the data required and the existing system. If the necessary information is already reliably available, an existing analysis or a complementary reporting solution may be sufficient. Missing data capture is a task of its own.
Why do production and controlling figures differ?
Possible reasons are different points in time, definitions, units, mappings or posting statuses. These causes should be checked on specific records before the report is adjusted.
Can an AI dashboard automatically explain schedule delays?
A display can make variances visible. A reliable explanation needs suitable further data and a verified analysis. Linguistic plausibility alone does not demonstrate a cause.
What data is needed for a pilot?
That depends on the chosen report. Order and item identifiers, relevant dates, quantities, confirmations and a known comparison result often help. First use the smallest scope of data that fully covers the task.
The publisher of this guide is T-NEX GmbH, which also offers its own reporting solution. Methodology and own interest
The next question