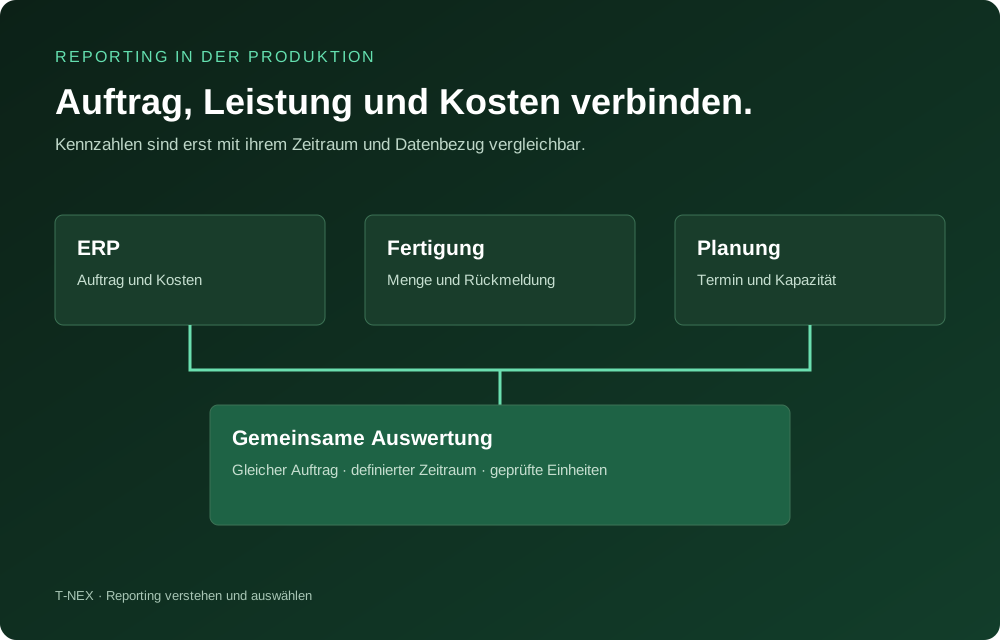
ERP and production reporting for orders, quantities and costs
If sales and production give different figures for an order, the order item, confirmation and posting must match. Use a partial delivery to check which data the ERP supplies and where a further source is needed.
51 specialist profiles and the supplementary offer from T-NEX
52 of 52 entries
Publisher's offer first · Other entries alphabetical
T-NEX
Publisher’s own offer
Dynamic AI Reporting · Custom analysis
For ERP data, T-NEX could develop an additional view of open orders or costs. Which data can be taken over from the existing system will be clarified for the project.
Example question Which items remain open on the reporting date if an order was only partly delivered?
Acumatica integrates reports, dashboards and query tools into its ERP system. Generic Inquiries provide data for analyses; further tools support report layouts, pivot views and role-dependent access. Reports can be adapted and made available to different recipients. The offer is worth examining if Acumatica already maps the operational processes. For German companies, the available country solution, the implementation partner and the requirements for existing finance and logistics reports expressly belong in the selection.
Assessment: Companies with Acumatica as their ERP basis.
Suitable tasks
Standard ERP reports; role-based dashboards; ad hoc analyses
Data and integration
Acumatica ERP via Generic Inquiries, Report Designer and analytical reports.
AI functions
Not documented as a function in the sources consulted. This does not mean that no AI is offered.
Operating model
Cloud ERP
Pricing basis
Price to be clarified in the project
Check before selecting
Check Germany localisation, report permissions and connections to external analyses.
AFAS provides management information from Profit through dashboards and a reporting cockpit. For the period close, income statement and annual financial statement views are described, among others. For use in Germany, the available account and report structures should be checked against the company's own financial statements, as the linked documentation describes the Dutch product context.
Assessment: Companies with an AFAS environment and commercial period reports.
Suitable tasks
Period report; income overview; management dashboards
Data and integration
Commercial and organisational data from AFAS Profit.
AI functions
Not documented as a function in the sources consulted. This does not mean that no AI is offered.
Operating model
Clarify the operating model for the specific part of the offer.
Pricing basis
Ask the provider about the price and the modules included.
Check before selecting
Which account assignment and reporting requirements does the country version offered for operation support?
ams.bi is geared towards company and project controlling in the ams.erp environment. The solution evaluates business KPIs and can prepare data from several clients, locations and operational systems for analysis. This approach is particularly relevant for project-oriented make-to-order and variant manufacturers. In the selection discussion, a real project report should show how order status, costs and other operational values are brought together and what data maintenance this requires in day-to-day business.
Assessment: Project-oriented make-to-order and variant manufacturing.
Suitable tasks
Project controlling; company KPIs; location analyses
Data and integration
ams.erp and other operational systems after integration; data across clients and locations.
AI functions
Not documented as a function in the sources consulted. This does not mean that no AI is offered.
Operating model
Not conclusively checked
Pricing basis
Price to be clarified in the project
Check before selecting
Check project structures, cost accrual and the scope of the data integration.
Aptean documents a dedicated BI extension for the Made2Manage Edition of its Industrial Manufacturing ERP. It visualises important data sources from the manufacturing environment. For a product comparison, the ERP edition is decisive, because a report from a Made2Manage project does not prove that a standard report exists in every other Aptean product line.
Assessment: Manufacturing companies that use or are evaluating Made2Manage.
Suitable tasks
Analyse manufacturing ERP; visualise data for specialist areas
Data and integration
Business data connected for the Made2Manage Edition.
AI functions
Not documented as a function in the sources consulted. This does not mean that no AI is offered.
Operating model
Clarify the operating model for the specific part of the offer.
Pricing basis
Ask the provider about the price and the modules included.
Check before selecting
Which analyses belong to the specific edition, and what is set up in addition?
APplus BI extends the ERP system from Asseco Solutions with analysis, planning and reporting functions. OLAP analyses consolidate data into KPIs and allow custom views of the business. Results can be passed to Excel, and configured monthly analyses can be generated again with current data. For mid-sized APplus users, this is an approach for recurring reports. What matters is which data models are available as standard and which business calculations are set up individually.
Assessment: Mid-sized companies with APplus.
Suitable tasks
Monthly analyses; KPI controlling; OLAP analyses
Data and integration
APplus ERP and other data sources set up for OLAP; Excel output.
AI functions
Not documented as a function in the sources consulted. This does not mean that no AI is offered.
Operating model
Not conclusively checked
Pricing basis
Price to be clarified in the project
Check before selecting
Check module scope, cubes that have been set up and responsibility for KPI definitions.
Cegid XRP Flex combines commercial and operational processes in a cloud ERP for small and medium-sized companies. The manufacturing documents describe customisable dashboards for analysing the processes. For a German company, an example with its own chart of accounts and a production context should clarify the scope of the country version offered.
Assessment: Companies that introduce ERP and analyses together.
Comarch offers business intelligence in the ERP environment. The reports can present data as lists, charts and maps. Ad hoc analyses are also provided for. In the selection test, it can be checked, for example, whether a consolidated regional sales view can be broken down by individual customers or product groups.
Assessment: Companies with reports spanning specialist areas in the ERP environment.
Suitable tasks
ERP reports; ad hoc analysis; regional KPIs
Data and integration
The business data set up for Comarch BI.
AI functions
Not documented as a function in the sources consulted. This does not mean that no AI is offered.
Operating model
Clarify the operating model for the specific part of the offer.
Pricing basis
Ask the provider about the price and the modules included.
Check before selecting
Which document types and data sources are already covered in the BI package required?
CONTACT Elements for IoT combines condition monitoring with the analysis of machine and plant data. Customisable dashboards, different chart types and freely definable KPIs support the ongoing observation of technical systems. The focus is on operating data and the relationship to the assets being managed. For companies, the offer is particularly worth examining if production or service data are to be brought into a common context. Required interfaces and the historisation of measured values belong in the project scope.
Assessment: Industrial companies with networked plants or technical service processes.
COSMO CONSULT supports the set-up of data platforms and reporting based on Microsoft technologies. The offer covers data strategy, architecture, integration and Power BI analyses. For Business Central there are also prepared Analytics QuickStart modules, for example for financial data. Companies should check how far such standard models already cover their own report. The selection should also take into account responsibilities for data quality, KPI definitions and operation, so that an initial visualisation becomes a reliably usable reporting process.
Assessment: Companies with a Microsoft data platform and a need for integration.
Suitable tasks
Data platforms; Power BI reporting; Business Central financial reports
Data and integration
ERP, CRM, IoT and other sources; QuickStart Finance on Business Central general ledger data.
AI functions
Not documented as a function in the sources consulted. This does not mean that no AI is offered.
Operating model
Cloud, local and hybrid architectures depending on the project
Pricing basis
Calculate licence and project costs separately.
Check before selecting
Delineate standard modules, individual integration and ongoing operation from one another.
Critical Manufacturing supplements its MES with dashboards, reports and a data and analytics framework. Production data can be examined in prepared or customised analyses. The current documentation also describes AI agents for questions about manufacturing data and the creation of dashboards in natural language. For companies, it is decisive which version and configuration provide these functions. A comparison should use a specific production case to check how KPIs are calculated and which data the respective agent may use.
Assessment: Industrial companies with complex manufacturing and MES needs.
Suitable tasks
Manufacturing reports; yield and scrap; AI data queries
Data and integration
MES data and other sources integrated into the Data Platform.
AI functions
Questions in natural language; Create reports / charts; Draft comments
Operating model
Not conclusively checked
Pricing basis
Price to be clarified in the project
Check before selecting
Check AI deployment, version, data rights and the analytics components required.
DELMIAWorks links production monitoring and analysis in the manufacturing ERP. Quantities produced, production times, downtimes and scrap are mentioned, among others. For implementation, the assignment of confirmations to the production order and process step is a suitable first checkpoint.
Assessment: Manufacturers that look at ERP and production monitoring together.
Suitable tasks
Production monitoring; scrap analysis; production times
Data and integration
Quantities, times and scrap in DELMIAWorks.
AI functions
Not documented as a function in the sources consulted. This does not mean that no AI is offered.
Operating model
Clarify the operating model for the specific part of the offer.
Pricing basis
Ask the provider about the price and the modules included.
Check before selecting
How are rework and scrap posted for multi-stage orders?
Vantagepoint is aimed at project-oriented architecture, engineering and consulting firms. The documentation describes project and general ledger reports, for which summarised data tables can be precalculated. When comparing project margin and financial report, it is therefore also necessary to check when the respective summary was last updated.
Assessment: Engineering firms and project-based service providers.
Suitable tasks
Project reports; general ledger reports; project performance
Data and integration
Project and general ledger data from Vantagepoint.
AI functions
Not documented as a function in the sources consulted. This does not mean that no AI is offered.
Operating model
Clarify the operating model for the specific part of the offer.
Pricing basis
Ask the provider about the price and the modules included.
Check before selecting
Which time, cost and posting statuses underlie the project margin being considered?
JobBOSS² prepares job costs for contract and make-to-order manufacturers. The reports can be filtered and traced down to transaction details. For post-calculation, an order with a subsequent material withdrawal is informative. It can be used to check when the additional expense appears in the order report.
Assessment: Make-to-order manufacturers with order-related post-calculation.
Suitable tasks
Job costs; post-calculation; reports for contract manufacturers
Data and integration
Order, inventory and financial data from JobBOSS².
AI functions
Not documented as a function in the sources consulted. This does not mean that no AI is offered.
Operating model
Clarify the operating model for the specific part of the offer.
Pricing basis
Ask the provider about the price and the modules included.
Check before selecting
How do late material or time postings affect completed orders?
Epicor Grow BI extends Epicor's ERP offers with data preparation and visual analyses. The product description mentions the connection of external platforms, data extraction and the creation of dashboards without programming of your own. For trading and manufacturing companies, this can create a view that goes beyond the individual ERP. Before a decision, a report should show which data models already exist and which sources or KPIs still have to be set up.
Assessment: Companies in the Epicor environment with additional BI needs.
Suitable tasks
ERP KPIs; sales and margin; inventory analysis
Data and integration
Epicor ERP and external platforms, databases and other business systems, depending on the connector.
AI functions
Not documented as a function in the sources consulted. This does not mean that no AI is offered.
Operating model
Cloud
Pricing basis
Price to be clarified in the project
Check before selecting
Check Grow BI and Grow AI separately in terms of functions and licensing.
Grow is an Epicor product, not an additional independent provider.
Exact Insights extends Exact's business software with business intelligence based on Qlik. The provider describes KPIs, trends and prepared dashboards for various operational areas. The offer is therefore aimed at companies that want to use their existing business data in a shared analysis view. Before introduction, the available product variant, the specific ERP integration and additional data sources should be checked. The product information evaluated comes from the British Exact site. weclapp offers analyses of sales and processes within its cloud ERP. The publicly presented feature overview also mentions static reports and analyses for accounting. The offer is a candidate for small and medium-sized companies that already run their business processes in weclapp. For the selection, a specific sample report counts: Which fields can be combined, which reports does the package contain, and when is an additional BI solution needed?
Assessment: Exact Insights powered by Qlik: Companies in the Exact environment. | weclapp ERP-Reporting: SMEs with weclapp ERP.
Suitable tasks
Company KPIs; ERP dashboards; area analyses; sales reports; process analyses; standard ERP reports
Data and integration
Exact Insights powered by Qlik: Exact business data; agree specific ERP versions and additional sources. | weclapp ERP-Reporting: Data from weclapp ERP.
AI functions
Exact Insights powered by Qlik: Not documented by function | weclapp ERP-Reporting: Not documented by function
Operating model
Exact Insights powered by Qlik: Not conclusively checked | weclapp ERP-Reporting: Cloud
Pricing basis
Exact Insights powered by Qlik: Price to be clarified in the project | weclapp ERP-Reporting: Check the current ERP package and the reporting scope required on the pricing page.
Check before selecting
Exact Insights powered by Qlik: Have availability and scope of services for the German market confirmed separately. | weclapp ERP-Reporting: Check standard reports, custom analyses and external BI integration separately.
The Exact and weclapp offers are combined in one provider entry because of their documented group affiliation. Function details remain assigned to the respective product.
FORCAM ENISCO combines machine data acquisition with production monitoring, OEE analyses and configurable dashboards. In the FORCE MES FLEX environment, availability, performance, quality and quantities are analysed via a shared data model. The provider addresses discrete manufacturing in particular, with different variants and batch sizes. For a reporting project, it should be clear whether sufficient machine data is already available or whether acquisition and context must first be built up. ERP connection and required MES functions are part of this delineation.
Assessment: Discrete manufacturing, especially variant and small-batch production.
Suitable tasks
OEE analyses; production reports; availability and scrap
Data and integration
Machine and operating data in the FORCE data model; ERP connection depending on configuration.
AI functions
Not documented as a function in the sources consulted. This does not mean that no AI is offered.
Operating model
On-premises MES; check cloud offers in the portfolio separately
Pricing basis
Price to be clarified in the project
Check before selecting
Do not treat MES FLEX, MES LITE and cloud offers as having an identical scope of functions.
FORCAM and ENISCO are combined in a current group profile.
Abas covers standard analyses in the ERP, further processing in Excel and a supplementary BI analysis. These include, for example, order backlog, open items, inventory values and business overviews. For more advanced analyses, the provider describes an MS SQL connector as well as report templates and cockpits. This is of interest above all to manufacturing companies that already work with Abas. In the selection, it should become clear which task the ERP itself handles and which additional solution is needed.
Assessment: Manufacturing mid-sized companies with Abas ERP.
Suitable tasks
Order backlog; inventory values; ERP controlling
Data and integration
Abas ERP; transfer via MS SQL connector and Excel export.
AI functions
Not documented as a function in the sources consulted. This does not mean that no AI is offered.
Operating model
Not conclusively checked
Pricing basis
Price to be clarified in the project
Check before selecting
Distinguish standard reporting, BI extension and, where applicable, TARGIT integration in the offer.
Abas and TARGIT belong to Forterro; combine them if groups are counted independently.
Frappe Insights is an open-source tool for data analysis and reporting. It connects tables and databases, prepares datasets and enables analyses via a visual query editor. The provider presents it as an accessible entry point for technical and business users. For companies in the Frappe or ERPNext environment, it is an obvious research candidate. Here too, the data model, operational responsibility and the requirements for shared reports must be defined before productive use.
Assessment: Companies with a Frappe/ERPNext connection and their own data expertise.
Suitable tasks
Analyses close to ERPNext; database reports; dashboards
Data and integration
Several databases, files and tables; check supported connections in the project.
AI functions
Not documented as a function in the sources consulted. This does not mean that no AI is offered.
Operating model
Open-source software; Frappe Cloud offer available
Pricing basis
Open-source licence; calculate hosting, set-up and support separately.
Check before selecting
Check supported database versions, operation and user permissions for the specific case.
Fulcrum presents shop-floor data in customisable reports and live dashboards. The Report Builder contains, among others, datasets for estimated and actual job costs and their breakdown. A suitable test task is the post-calculation of a single order whose material and labour costs deviate from the estimate to differing degrees.
Assessment: Make-to-order manufacturers with regular target-versus-actual comparison.
With gevis BI, GWS offers analysis models and reports tailored to trade. The solution uses existing ERP data, for example for purchasing, sales, contribution margin and open items. gevis BI ONE extends this approach with Power BI-based models and report delivery. For gevis users, it is worth checking the existing standard models before building their own analyses. The offer should clearly describe the product variant, data source, user and recipient licences and the scope of implementation.
Assessment: Trading companies with gevis ERP.
Suitable tasks
Trade KPIs; sales and contribution margin; open items
Data and integration
gevis ERP; additional company data after integration.
AI functions
Not documented as a function in the sources consulted. This does not mean that no AI is offered.
Operating model
Microsoft Azure Cloud; check hybrid variants in the offer.
Pricing basis
Check gevis and Microsoft licences as well as report recipient licences according to use.
Check before selecting
Have the prerequisites and availability of the respective gevis BI variant confirmed.
IFS Business Reporter uses Excel as the interface for analytical reports on data from IFS Cloud. Predefined information models provide the basis for totals, dimensions and custom calculations. Reports can be published, run on a schedule and distributed. For selected information sources, write-back of planning data is also provided for. The offer suits organisations that want to design their IFS reporting in Excel and manage report logic, permissions and execution centrally.
Assessment: Existing IFS users with Excel-based reporting.
Infor Birst is a cloud-based analytics platform with prebuilt content for industries and operational roles. It consolidates data from several sources into reports and dashboards and can embed analyses in workflows. For Infor users, the existing industry content is a possible starting point. What remains decisive is how custom KPIs, external sources and access rights are implemented. Documented AI summaries should be checked in the respective product version and tenant.
Assessment: Companies with Infor systems or a need for industry-specific BI.
Suitable tasks
Industry reporting; ERP analyses; management dashboards
Data and integration
Several company sources; prebuilt data models and Infor industry data depending on the package.
AI functions
Draft comments; detect anomalies
Operating model
Cloud
Pricing basis
Price to be clarified in the project
Check before selecting
Check specifically the availability of Insight Summaries and the industry models included.
INOSIM Foresight uses current plant information and simulation models to estimate the next hours or days of a production process. The results are provided in task-specific dashboards. The offer is aimed mainly at the process industry and supports, for example, the assessment of bottlenecks or maintenance windows. For the selection, it must be clarified which digital twin is required and how its statements are verified. A simulation-based forecast is to be distinguished here from a general AI analysis.
Assessment: Process industry with complex batch or production processes.
Suitable tasks
Production preview; bottleneck assessment; maintenance planning
Data and integration
Current status data of real plants in connection with INOSIM simulation models.
AI functions
Not documented as a function in the sources consulted. This does not mean that no AI is offered.
Operating model
Not conclusively checked
Pricing basis
Price to be clarified in the project
Check before selecting
Check modelling effort, data updating and validation of the digital twin.
Iptor documents the Business Insight Pack based on Qlik Sense for its ERP environment. It supports graphical and freely assembled reports. For trade, a report on inventory and movements is a good starting point. It should become visible which values are taken from the ERP and which are calculated in the BI model.
Assessment: Distribution companies with Iptor ERP.
Suitable tasks
Trade KPIs; ERP analyses; ad hoc reports
Data and integration
Data from the Iptor environment in the Business Insight Pack.
AI functions
Not documented as a function in the sources consulted. This does not mean that no AI is offered.
Operating model
Clarify the operating model for the specific part of the offer.
Pricing basis
Ask the provider about the price and the modules included.
Check before selecting
How often is the BI model updated from operational inventory?
iTAC bundles machine and process data in the Asset.Analyzer for operational production analyses. Dashboards combine current KPIs with historical values; AI-supported indications of anomalies and possible faults are also documented. The provider describes use as a standalone solution or within an existing system landscape. For the selection, companies should take a specific plant and check which signals, states and context information are required for reliable statements. The existing data basis determines the sensible scope.
Assessment: Production management and maintenance with a need for machine analyses.
Suitable tasks
Production KPIs; downtime analysis; anomaly indications
Data and integration
Machine and process data; overarching context from connected production systems.
AI functions
Detect anomalies; Create forecasts
Operating model
Standalone or integrated; check the specific operating form
Pricing basis
Price to be clarified in the project
Check before selecting
Check data integration, degree of coverage and informative value of the AI functions using reference cases.
In Manufacturing Insights, Katana distinguishes between cost overview, materials used and resources. This allows a production order to be viewed from several angles. The selection test should include an order with deviating material consumption, so that quantity, valuation and cost consequences can be traced separately.
Assessment: Businesses with order-related material and resource costing.
Suitable tasks
Manufacturing costs; material consumption; resource use
Data and integration
Manufacturing, material and resource data from Katana.
AI functions
Not documented as a function in the sources consulted. This does not mean that no AI is offered.
Operating model
Clarify the operating model for the specific part of the offer.
Pricing basis
Ask the provider about the price and the modules included.
Check before selecting
Which cost basis applies to materials with different purchase prices?
mesonic combines WinLine BI with a module for internal report distribution. Analyses from the Power Report can be passed on to individuals or groups, for example as a graphic, PowerPoint or HTML. For recurring daily, weekly and monthly reports, the provider describes scheduled creation and forwarding via the ACTIONSERVER. The offer suits WinLine users who want to standardise the path from analysis to recipient and select the appropriate combination of modules for this.
The microtech merchandise management system can create payment forecasts from open items or existing customer orders. For further dashboard analyses, the provider describes sales statistics from sales and purchasing. These data are built up locally and made available for analyses in the ERP Cloud.
Assessment: Commercial management of businesses with microtech merchandise management.
Suitable tasks
Payment forecast; sales statistics; purchasing and sales comparison
Data and integration
Open items, customer orders and locally built statistics data.
AI functions
Not documented as a function in the sources consulted. This does not mean that no AI is offered.
Operating model
Clarify the operating model for the specific part of the offer.
Pricing basis
Ask the provider about the price and the modules included.
Check before selecting
How are expected payments from orders separated from open items that have already been invoiced?
MODUS Consult supports companies in introducing Power BI and in extending existing reporting systems. The offer ranges from the initial analysis to productive use. Data from different sources are brought together in reports and dashboards. For companies in the Microsoft Dynamics environment, it is above all the implementation service that is relevant. A selection discussion should use a specific report to clarify who is responsible for data models, permissions, updating and later further development.
Assessment: Companies in a Microsoft environment with a need for implementation partners.
Suitable tasks
Power BI introduction; data models; Dynamics reporting
Data and integration
Different company sources; Microsoft Dynamics connection depending on the project.
AI functions
Not documented as a function in the sources consulted. This does not mean that no AI is offered.
Operating model
Depends on the agreed Microsoft architecture
Pricing basis
Calculate licence and project costs separately.
Check before selecting
Separate the service provider's services from Microsoft product functions and licence prerequisites.
Monitor BI delivers preconfigured dashboards for manufacturing companies. Users can adapt these views or create new dashboards. The analyses relate to production, purchasing, sales, warehouse and finance, among others. For a demonstration, an order is a good choice whose delivery status and financial result are to be explained from two specialist areas.
Assessment: Manufacturing businesses in the Monitor ERP environment.
Suitable tasks
Production overview; purchasing KPIs; warehouse reports
Data and integration
Business data from Monitor ERP.
AI functions
Not documented as a function in the sources consulted. This does not mean that no AI is offered.
Operating model
Clarify the operating model for the specific part of the offer.
Pricing basis
Ask the provider about the price and the modules included.
Check before selecting
Which KPI definitions does the selected version already include?
In the HYDRA X environment, MPDV offers analyses of machine states, process data and quality KPIs. Historical values can be examined in tables or graphically and linked to orders. Supplementary AI applications can, for example, forecast setup times from past order data. For production managers, it is important which data are already recorded and which mApps are required. The specialist selection should use a specific line to show how downtimes, scrap and order reference fit together and where additional data capture is still needed.
Assessment: Manufacturing companies with a need for detailed MES analyses.
Suitable tasks
Process data analysis; machine states; setup time forecasts
Data and integration
Virtual Production Reality of the MPDV Manufacturing Integration Platform; recorded machine, process and order data.
AI functions
Create forecasts
Operating model
Not conclusively checked
Pricing basis
Price to be clarified in the project
Check before selecting
Determine the mApps required, existing data capture and the AI module separately.
In production planning, MRPeasy generates statistical reports from production orders. The period can be freely chosen or taken from presets. The results can be saved as PDF. This allows a clearly delimited start if the order data are already in MRPeasy and are to be analysed regularly.
Assessment: Smaller manufacturers with production orders that are already maintained.
Suitable tasks
Production order statistics; period reports; PDF output
Data and integration
Production orders in MRPeasy.
AI functions
Not documented as a function in the sources consulted. This does not mean that no AI is offered.
Operating model
Clarify the operating model for the specific part of the offer.
Pricing basis
Ask the provider about the price and the modules included.
Check before selecting
Which date determines the reporting period of an order that runs across the month end?
Odoo Spreadsheet combines spreadsheet calculation with the data from Odoo applications. Users can assemble lists, pivot analyses, charts and shared filters into reports. Such spreadsheets also form the basis for customisable dashboards. The approach is of interest to companies whose relevant processes are already in Odoo and who want to keep a familiar spreadsheet view. In the selection, edition, access rights, data updating and the integration of information outside the Odoo database should be clarified.
Assessment: Companies with Odoo as their operational data basis.
Orbit offers operational reporting on data from business applications. The provider also addresses ad hoc analyses in the ERP environment. In the selection project, users should trace a typical business transaction to its appearance in the report and reconcile the figures with the specialist application.
Assessment: Teams with ERP-related analyses and recurring additional questions.
Suitable tasks
Operational ERP reports; ad hoc analyses
Data and integration
Operational data from the supported ERP applications.
AI functions
Not documented as a function in the sources consulted. This does not mean that no AI is offered.
Operating model
Clarify the operating form for the chosen output.
Pricing basis
Check the licence scope and terms with the provider.
Check before selecting
Which ERP version, data latency and access role does the model offered cover?
TrakSYS from Parsec Automation presents production KPIs across lines and sites in configurable dashboards. The platform links production, quality and plant data with roles, shifts and operating locations. Cross-site reports can combine a central view with local analyses. For manufacturing companies, the shared data context is an important selection point. The implementation should therefore show how events and downtimes are recorded and which KPIs on each line are actually produced according to the same rule.
Assessment: Manufacturing companies with several lines or sites.
Suitable tasks
Cross-site KPIs; OEE monitoring; shift analyses
Data and integration
Machines, people, systems and processes; normalised OT/IT data in the TrakSYS model.
AI functions
Not documented as a function in the sources consulted. This does not mean that no AI is offered.
Operating model
Hybrid, cloud and on-premises according to the platform description
Pricing basis
Price to be clarified in the project
Check before selecting
Check uniform event models, roles and site-specific adaptations.
Peakboard brings production data from different technical and operational sources onto customisable dashboards. The provider describes direct connections to ERP and MES data as well as machine controllers. The display can run on a Peakboard Box or on your own hardware. For production managers, the offer is of particular interest for visualisation on the shop floor. Before a decision, data updating, write-backs, KPI definitions and the delineation from longer-term analyses should be checked, so that display and report use the same data basis.
Assessment: Production and shop floor with a need for direct KPI views.
Suitable tasks
Production visualisation; OEE dashboards; shop-floor boards
Data and integration
ERP/MES databases, SQL, OPC UA and Siemens S7 according to the product page.
AI functions
Not documented as a function in the sources consulted. This does not mean that no AI is offered.
Operating model
On-premises on Peakboard Box or your own hardware.
Pricing basis
Device/BYOD licence; clarify the current project price and additional scope.
Check before selecting
Check data connections, local hardware and the scope of supplementary analytics.
With the Reporting Studio, Corporate Planning offers a dedicated component for management reports, presentations and dynamic dashboards. The solution is thus aimed at controlling teams that want to pass figures to managers in a recurring, comparable form. The focus is on the design and use of reports within corporate management. For a selection project, a comparison using your own report package is therefore worthwhile: Which views are needed, who maintains them and which data are already available? Within its ERP landscape, Proalpha offers several routes to analysis: a management information system for regular reports, business cockpits for specialist areas and the Analyzer for more advanced questions. Purchasing, materials management, production, sales and finance each receive suitable KPI views. For companies with Proalpha, it is therefore worth first checking the existing modules. Additional data sources, permissions and the maintenance of custom KPIs should be clarified using a specific report.
Assessment: Corporate Planner Reporting Studio: Controlling teams with recurring report packages and defined presentation rules. | Proalpha BI, Business Cockpits und Analyzer: Mid-sized companies with Proalpha ERP.
Suitable tasks
Management reports; presentations; controlling dashboards; monthly reports; area KPIs; ad hoc analyses
Data and integration
Corporate Planner Reporting Studio: Check specific source systems and connectors for your own use. | Proalpha BI, Business Cockpits und Analyzer: Proalpha ERP; cockpits can be based on several data sources.
AI functions
Corporate Planner Reporting Studio: Not documented by function | Proalpha BI, Business Cockpits und Analyzer: Not documented by function
Operating model
Corporate Planner Reporting Studio: Not conclusively checked | Proalpha BI, Business Cockpits und Analyzer: Not conclusively checked
Pricing basis
Corporate Planner Reporting Studio: Price to be clarified in the project | Proalpha BI, Business Cockpits und Analyzer: Price to be clarified in the project
Check before selecting
Corporate Planner Reporting Studio: Check: Corporate Planning modules in use, data supply and approval or distribution process. | Proalpha BI, Business Cockpits und Analyzer: Agree BI modules and additional sources separately; do not equate general group AI offers with the Analyzer.
The Corporate Planning and Proalpha offers are combined in one provider entry because of their documented group affiliation. Function details remain assigned to the respective product.
PSIpenta Smart Planning & Analytics combines classic business intelligence functions with support for commercial planning tasks. The solution is aimed at the manufacturing mid-sized sector and provides KPIs, analyses and reports from the operational context. It is therefore particularly relevant for companies in the PSIpenta environment. For the selection, a specific monthly or order report should clarify which KPIs are already modelled, how plan values are incorporated and which additional data sources or calculations must be set up.
Assessment: Manufacturing mid-sized companies, especially with PSIpenta ERP.
Suitable tasks
Company KPIs; production-related controlling; commercial planning
Data and integration
Data in the PSIpenta environment; check specific sources and models in the project.
AI functions
Not documented as a function in the sources consulted. This does not mean that no AI is offered.
Operating model
Not conclusively checked
Pricing basis
Price to be clarified in the project
Check before selecting
Have reporting and experience-based planning demonstrated separately.
ReportsNow Data Access Studio is geared towards reporting in the JD Edwards environment. For companies with this ERP, it can be a supplement to existing standard reports. Customer-specific fields and the business interpretation of the tables in particular should be included in the test.
Assessment: Companies that use Oracle JD Edwards.
Suitable tasks
JD Edwards reporting; specialist area analyses
Data and integration
JD Edwards data.
AI functions
Not documented as a function in the sources consulted. This does not mean that no AI is offered.
Operating model
Clarify the operating form for the chosen output.
Pricing basis
Check the licence scope and terms with the provider.
Check before selecting
Which customisations of your JD Edwards installation does the reporting environment offered recognise?
reybex offers a sales cockpit and its own dashboards in its cloud ERP. For BAS23 reports and BAS09 widgets, the provider documents AI-supported creation without your own SQL knowledge. At acceptance, a known sales KPI with cancellations and credit notes should show whether the generated definition matches the company's view.
Assessment: Sales and controlling with analysis needs in the reybex system.
Suitable tasks
Sales reports; dashboard widgets; customer sales
Data and integration
Business data and report definitions in reybex ERP.
AI functions
Create reports / charts
Operating model
Cloud ERP.
Pricing basis
Ask the provider about the price and the modules included.
Check before selecting
Which permissions apply to the data fields of an analysis created with AI support?
Plex Reporting & Analytics provides analyses within the Plex manufacturing platform. Role-based dashboards and self-service tools help to analyse existing production and business data. Reports can be scheduled and distributed; access rights control which information is visible. For companies with Plex, this is a candidate for a shared operational and business view. Before introduction, an end-to-end report should show how production values, periods and financial KPIs fit together and which additional data are required.
Assessment: Manufacturing companies with Plex.
Suitable tasks
Manufacturing KPIs; role-based reports; ERP and production analyses
Data and integration
Data within the Plex Smart Manufacturing Platform.
AI functions
Not documented as a function in the sources consulted. This does not mean that no AI is offered.
Operating model
Cloud platform
Pricing basis
Price to be clarified in the project
Check before selecting
Check the analytics package included, data history and additional sources.
Plex belongs to the Rockwell offer; no additional entry as an independent manufacturer.
Sage 100 Smart BI is an add-on solution for dashboards and analyses documented on the German Sage site. The data sheet mentions a standard integration for Sage 100, additional databases, filters, drill-down and a dashboard designer. User-dependent views can be provided in the web client. For German Sage 100 users, this connection is particularly important, because Sage products of the same name in other countries may have different reporting components. The specific version and the implementation partner should therefore be stated in the offer.
Assessment: German Sage 100 users.
Suitable tasks
Sage 100 KPIs; web dashboards; ERP analyses
Data and integration
Sage 100 and additional databases according to the data sheet.
AI functions
Not documented as a function in the sources consulted. This does not mean that no AI is offered.
Operating model
Web client; check the specific hosting variant
Pricing basis
Price to be clarified in the project
Check before selecting
Add-on solution from Datatronic; do not equate with the functions of the US version of Sage 100.
AVEVA Reports for Operations is geared towards reports from industrial operating data. The software processes manual inputs, current values and historical data from different sources and provides them in configurable reports. Creation takes place via graphical tools. The offer is of interest to plant operators who have to produce recurring operating or performance reports. In the comparison, data sources, archive periods, report layouts and the desired distribution should be tested using a typical production report. RIB BI+ is the current product address of the analytics tool formerly offered as datapine. The current presentation concentrates on construction and combines customisable dashboards with industry-specific KPIs. AI-supported alerts are intended to detect patterns and notable changes. For companies in construction and project business, a selection case that looks at costs and operational data together makes sense. The specific origin, updating and business meaning of each KPI used should become visible in the process.
Assessment: AVEVA Reports for Operations: Industrial and plant operators with recurring operational reporting. | RIB BI+: Construction companies and project-oriented organisations
Suitable tasks
Operating reports; performance reports; historical analyses; reporting in construction; project-related dashboards; indications of data anomalies
Data and integration
AVEVA Reports for Operations: Historian systems, business software, relational databases and manual data. | RIB BI+: Check specific project and company data sources with RIB
AI functions
AVEVA Reports for Operations: Not documented by function | RIB BI+: Detect anomalies
Operating model
AVEVA Reports for Operations: Not conclusively checked | RIB BI+: Not conclusively checked
Pricing basis
AVEVA Reports for Operations: Price to be clarified in the project | RIB BI+: Price to be clarified in the project
Check before selecting
AVEVA Reports for Operations: Check required drivers, report distribution and operating architecture. | RIB BI+: Check the integration of existing systems, KPI definitions and alarm rules.
The offers from AVEVA and RIB Software are recorded together under Schneider Electric.
SIMATIC Performance Insight calculates and visualises machine KPIs in dashboards and reports. The provider mentions OEE, availability and KPIs on failures and repairs, among others. Custom formulas and different widgets allow adaptation to a specific machine or line. For manufacturing companies, this is a targeted building block for the production view. Before the selection, the deployment variant, required signals and KPI definitions should be fixed, so that reports become genuinely comparable across plants.
Assessment: Manufacturing with suitable Siemens or Industrial Edge components.
Suitable tasks
OEE; machine performance; plant reports
Data and integration
Machine data via the respective SIMATIC/Industrial Edge environment.
AI functions
Not documented as a function in the sources consulted. This does not mean that no AI is offered.
Operating model
Variants for Industrial Edge, Unified Comfort Panel and Insights Hub.
Pricing basis
Price to be clarified in the project
Check before selecting
Check deployment variant, asset licensing and available machine signals.
Softengine describes an integrated module for analyses and reporting from its ERP landscape. KPIs from merchandise management, financial accounting, production and sales appear in configurable dashboards. Standard reports and individually set-up analyses can be generated and distributed on a schedule. The approach suits mid-sized companies that want to build reports close to their operational processes. At introduction, KPI definitions, period boundaries and the specific product variant should be reconciled with an existing monthly report.
Assessment: Mid-sized companies with Softengine ERP.
Suitable tasks
ERP monthly reports; target-versus-actual comparisons; automatic report distribution
Data and integration
Operational Softengine ERP data from merchandise management, financial accounting, CRM and production.
AI functions
Not documented as a function in the sources consulted. This does not mean that no AI is offered.
Operating model
Not conclusively checked
Pricing basis
Price to be clarified in the project
Check before selecting
Check licence scope, report configuration and responsibility for threshold values.
Syspro Reporting Services provides reports from the ERP, for example on financial data. The documentation on Embedded Analytics also describes the export and import of standard or custom-built dashboard packages. With several instances, this is relevant if plants are to work with the same KPI model.
Assessment: Companies with Syspro ERP and several reporting areas.
TSO-DATA offers prepared reporting solutions for Microsoft Dynamics 365 Business Central based on Power BI. The report packages cover sales, purchasing, finance and logistics, among others. Data models and dashboards are set up and can be adapted to company requirements. The approach is of interest to Business Central users who want to move existing KPIs into a shared analysis more quickly. What should be compared are the scope of the prepared models, additional Microsoft licences and responsibility for later adaptations.
Assessment: Companies with Business Central and a need for prepared dashboards.
Suitable tasks
Business Central reporting; sales KPIs; warehouse and logistics
Data and integration
Microsoft Dynamics 365 Business Central; further sources via prepared or custom interfaces.
AI functions
Not documented as a function in the sources consulted. This does not mean that no AI is offered.
Operating model
On-premises with SQL Server or cloud-based with Microsoft Fabric.
Pricing basis
Subscription plus the Microsoft Power BI licences required and project services.
Check before selecting
Record report packages, additional interfaces and optional AI extensions in the offer.
Tulip Analytics analyses data from applications, tables and machines within the Frontline Operations platform. Users can create charts and KPIs and make them available in dashboards or work applications. The approach is particularly suitable if specialist areas already map processes and data capture in Tulip. For the reporting selection, data model, time reference and access rights should be checked on a real manufacturing case. Automatically scheduled report distribution is to be clarified separately and is not assumed here.
Assessment: Companies with Tulip applications on the shop floor.
For the ERP variant for architecture and engineering firms, Unanet mentions interactive reports on project profitability, budget, schedules and unbilled services. For the other variant, GovCon, Analytics Studio is documented as an add-on offer. The functions required should be expressly assigned to the ERP variant offered.
Assessment: Project-oriented service providers with a need for commercial project reports.
Unit4 geared its ERP reporting tools particularly towards service-oriented organisations. Financial, personnel and project data can come together in role-based dashboards and modifiable reporting structures. The current product page also describes AI-supported indications of anomalies. For service providers, universities or non-profit organisations, the fit with the respective business model should therefore be checked. A demonstration should show how KPIs remain traceable when teams, projects or organisational structures change, and who may edit the reports.
Assessment: Service companies and other personnel- or project-oriented organisations.
Suitable tasks
Project profitability; staff utilisation; financial and project reporting
Data and integration
Financial, HR and project data within Unit4 ERP.
AI functions
Detect anomalies
Operating model
Not conclusively checked
Pricing basis
Price to be clarified in the project
Check before selecting
Have AI functions, ERP version and permission concept confirmed for the specific package.
Xentral connects reporting with the operational data of its ERP system. Templates, a no-code editor and an SQL editor cover different analysis needs. The Analytics Copilot supplements report creation with questions in everyday language. For trading companies, sales, gross profit, inventory and returns are particularly relevant. Before the selection, companies should check which reports are included in the package booked and how often the data required can be updated.
Assessment: Trading companies and SMEs that use Xentral.
Suitable tasks
Sales and gross profit; inventories; returns
Data and integration
Data from Xentral ERP; check other data routes separately.
AI functions
Questions in natural language; Create reports / charts
Operating model
Cloud ERP
Pricing basis
Free basic package and paid reporting packages; check current amounts in the Xentral app store.
Check before selecting
Check package scope, query quota and update interval.