
T-NEX provider register
Automate monthly reports from Excel and ERP
If controlling transfers postings from the ERP to Excel every month, the last approved report shows which totals have to match again. Three cost centres can be used to check which steps up to approval can be automated.
What does automating a monthly report involve?
Automating monthly reporting means defining the recurring work steps of a report so that they can be reliably run again with new data. This includes importing the data, mapping it, calculating KPIs, checks and the output. A new chart draft alone does not yet automate this process.
First note down the report’s current route. Who exports which file? Who adds values? What queries arise? Where are formulas changed? Who sends out the result? Separate processing time from waiting time here. If an approval takes several days, a faster data import will not automatically shorten it.
Choose a manageable first report with regular demand and a known calculation. A cost centre comparison is suitable for this if Plan and Actual can be clearly assigned. For a complex group of companies, a different starting point may be more appropriate. The choice should be guided by your effort and the data quality available.
Model case · sample data
One monthly report. Three cost centres.
| Cost centre | Plan | Actual | Variance |
|---|---|---|---|
| Production | 42.000 € | 45.000 € | +3.000 € |
| Sales | 28.000 € | 25.500 € | -2.500 € |
| Administration | 20.000 € | 22.000 € | +2.000 € |
Checksum: €92,500 Actual = €45,000 + €25,500 + €22,000.
This interactive display explains the model case. It is not a live connection to the T-NEX product and runs no AI queries. The figures are freely chosen sample data. A higher Actual value denotes higher costs here; the cause must be checked separately.
Sample case: three cost centres and a Plan/Actual comparison
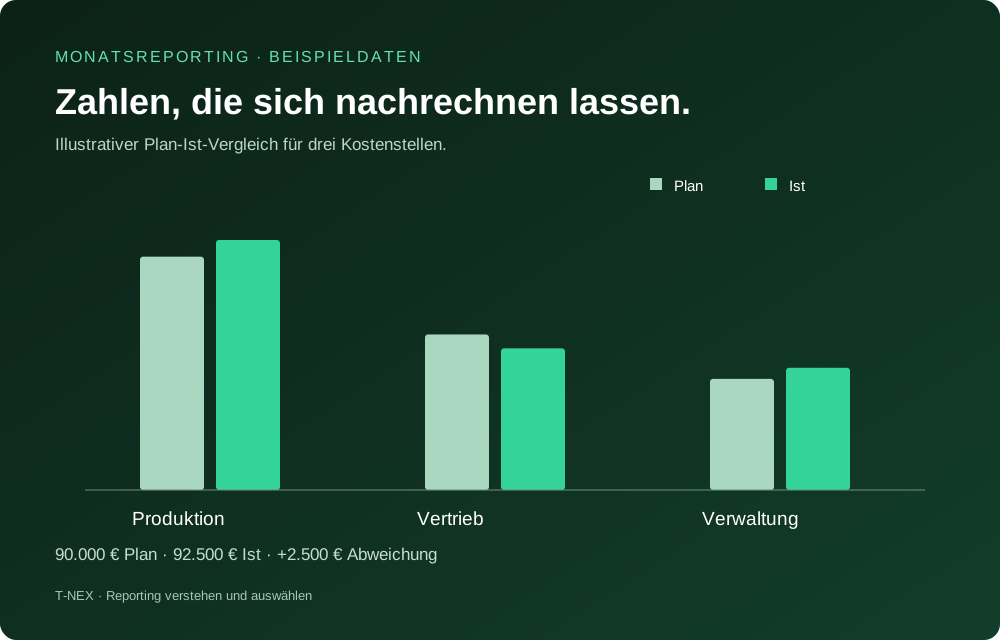
The following example uses invented amounts. It is an aid for calculation and checking, not a customer reference and not evidence of any savings achieved. A closed month is considered. All values are costs in euros; a positive variance means higher costs than planned.
| Cost centre | Plan | Actual | Actual minus Plan |
|---|---|---|---|
| Production | 42.000 € | 45.000 € | +3.000 € |
| Sales | 28.000 € | 25.500 € | −2.500 € |
| Administration | 20.000 € | 22.000 € | +2.000 € |
| Total | 90.000 € | 92.500 € | +2.500 € |
The total variance is €2,500. In relation to the total plan, this is 2.78 per cent when rounded. The three individual percentage variances are not added up or averaged without weighting for this purpose. The calculation is made from the total values.
A matching report shows Plan, Actual and variance per cost centre as well as the two overall totals. A comment can note that the lower sales costs offset part of the higher costs in production and administration. The table does not yet contain an explanation of the causes.
What details the input data needs
For the sample case, a table is sufficient whose rows are clearly assigned to a cost centre, a period and a value type. In your company, further attributes may be necessary, such as legal entity, site, currency or cost type. These attributes determine which analyses will be possible later.
Record a short agreement for the source: Which columns are delivered? Which date format applies? How are empty values represented? Which file or table is authoritative? By when is the month closed? Name one contact person for professional changes and one for technical changes.
If postings arrive retrospectively, the monthly report needs a clear rule. Either a published version stays frozen and a correction is provided as a new version, or the report continues to update and indicates its data status. Both options can make sense. Recipients must know which one they have in front of them.
For refreshed dashboards, the entire data chain must also be considered. Using Power BI as an example, Microsoft explainsthat data import and presentation are refreshed differently depending on the storage and connection mode. For your project, this gives rise to the following question to check: Which step is complete when the report says “refreshed”?
Which checks should run before every release
Define checks for the errors that can actually occur in your report. For the sample case, the following controls are sensible:
- Completeness: All three expected cost centres are present in the intended period.
- Uniqueness: A row is not counted twice because of a repeated import.
- Value types: Plan and Actual are processed separately and then correctly assigned.
- Unit: Amounts in euros and cents are not mixed.
- Checksums: The aggregated values match the approved source totals.
- Period: The selected month corresponds to the professionally agreed closing status.
- Calculation rule: Absolute and percentage variances use the defined direction and base.
For each failed check, define what should happen. If a data source is incomplete, release can be stopped. In the case of a known professional exception, a responsible person can decide and document the matter. A red warning without anyone responsible does not yet resolve the error.
Also test a plan value of zero. In this case a percentage variance cannot sensibly be calculated by division. The report should show the absolute difference and label the percentage value clearly as not calculable.
How figures, comments and approval fit together
A monthly report becomes more useful if it explains the decisive changes. Separate three levels for this: What do the figures say? Which cause has been checked? Which decision or further check is required?
In the sample case, the statement “Total costs are €2,500 above plan” is directly substantiated. A statement such as “This is due to additional material purchases” would be unsubstantiated without further information. Ask the responsible cost centre for the necessary assessment and record which report status it relates to.
An AI-assisted draft text can support the preparation. It should distinguish traceably between figures and assumptions. Specify that missing causes are to be treated as open points. Whether and how the selected product creates such comments belongs in the provider check.
Professional approval needs a named person responsible. Clarify whether the report serves only for internal orientation or goes into a binding decision paper. Automatic dispatch and a formal approval workflow are separate requirements; they should be stated explicitly in the scope of services offered.
Introduction in four manageable steps
- Rebuild a historical month. Use a closed period with a known report. If figures and presentation match, the basic rules can be checked.
- Introduce deliberate errors. Test a duplicate row, a missing cost centre, a zero value and a wrong period. Observe the response and correct the processing.
- Run a new month in parallel. Produce the report with the previous and the new method. Investigate differences back to the source.
- Hand over responsibility. Document data access, refresh, checks, error handling and change routes. Only then does the new process become the regular procedure.
Plan a limited transition period. Two permanently parallel reporting worlds create maintenance effort of their own. Therefore define when the old report is retired and under which conditions it can be fallen back on.
At T-NEX, such a reference report can serve as a starting point for Dynamic AI Reporting . The specific project scope is determined on the basis of the source, the desired analysis and the agreed check.
Which documents should remain after introduction
A short, understandable operating description belongs with the introduced monthly report. It names the data source, the refresh route, the checks and the persons responsible. Add instructions for the most common faults, such as a missing file or a new cost centre.
The professional documentation describes KPIs, signs and periods. Also keep the acceptance cases used. If a field or a calculation is changed later, these cases can be checked again. This makes it possible to tell whether an adjustment has unintentionally changed other results.
Also determine who takes over during holidays or when a responsible person changes. In everyday work, a report is reliably looked after only when its creation can be traced even without the original author.
How to tell whether the changeover is worthwhile
Measure the current and the new process with the same delimitation. Record the time actually spent on data import, corrections, presentation and checking. Also record the time until release and the number of subsequent corrections.
A shorter processing time is initially freed-up capacity. Whether this results in a financial saving depends on how that capacity is used. Additional analyses can have a benefit even if personnel costs remain unchanged. Describe this benefit accordingly.
Also assess maintenance. Who adds a new cost centre? How is a changed chart of accounts adopted? What does a further data source cost? The answer belongs, together with licences and operation, in the cost analysis for reporting software.
If the main work today lies in workbooks, the guide Automating Excel reporting offers a suitable complement. For the provider search, the reporting register leads to the respective solution categories.
Frequently asked questions
Can the monthly report be produced fully automatically?
Technically, many steps can be run repeatably. For your report, it must nevertheless be defined which errors stop the processing and who decides professional exceptions. Commentary, approval and dispatch have to be checked separately.
Does the data source for the monthly report have to be connected in real time?
Not necessarily. For a closed monthly report, a traceable data status can be more suitable. What matters is when the figures count as complete and whether later changes should remain visible.
How can the correctness of a new report be checked?
Use a known historical report with the same KPIs, filters and periods. Compare individual values and totals. Deliberately add faulty inputs in order to also assess the error handling.
Which documents are helpful for a first conversation?
A previous report, a description or anonymised example of the data source, the most important KPI definitions and the current process. This helps to narrow down the task and the yardstick for checking.
The publisher of this guide is T-NEX GmbH, which also offers its own reporting solution. Methodology and own interest
The next question