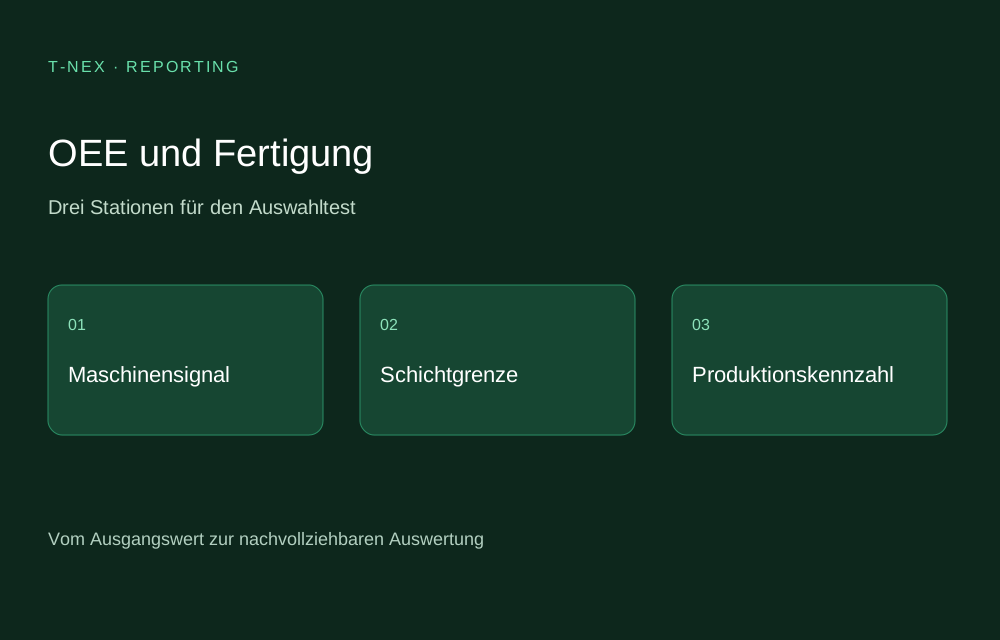
Evaluate production KPIs and OEE by plant, line and shift
Plant management and production controlling need comparable figures, even if two sites record setup times or downtime differently. Have the overall equipment effectiveness recalculated for a completed shift.
20 specialist profiles and the supplementary offer from T-NEX
21 of 21 entries
Publisher's offer first · Other entries alphabetical
T-NEX
Publisher’s own offer
Dynamic AI Reporting · Custom analysis
In manufacturing, T-NEX could be used to try out a comparison of good quantity by line and shift. This would require order reference, feedback messages and shift boundaries to match the existing production report.
Example question How is the good quantity reported when an order runs beyond the shift change?
Axiom is the visualisation and reporting component of the Canary System. Users combine time series and dashboards. For automated reports, Canary documents scheduling and an overview of reports already run. This is relevant if the same process view is to go regularly to a defined group of recipients.
Assessment: Plants with industrial historian data and fixed reporting cycles.
Suitable tasks
Time series analysis; plant dashboards; scheduled reports
Data and integration
Process time series and configured views available in the Canary System.
AI functions
Not documented as a function in the sources consulted. This does not mean that no AI is offered.
Operating model
Clarify the operating model for the specific part of the offer.
Pricing basis
Ask the provider about the price and the modules included.
Check before selecting
Can a failure of data recording be distinguished in the report from a constant measured value?
ConSense's KPI module offers manual and automatic recording, visualisation and report generation. A traffic-light display helps with assessment. For the management meeting, it should be settled in advance which period the KPI comes from and who explains a threshold violation.
Assessment: Process owners with shared reporting cycles.
Suitable tasks
Process assessment; KPI reports; management review
Data and integration
Manual characteristic values and data from configured sources.
AI functions
Not documented as a function in the sources consulted. This does not mean that no AI is offered.
Operating model
Clarify the operating model for the specific part of the offer.
Pricing basis
Ask the provider about the price and the modules included.
Check before selecting
How are changed target values treated in the prior-year comparison?
zenon's Report Engine analyses data from the production platform for technical and commercial recipients. This allows a recurring report to be built on recording already in place on the shop floor. For specialist acceptance, it should be established for every condensed figure which process signal and time base it comes from.
Assessment: Operators of a zenon environment with recurring production reports.
Suitable tasks
Production reporting; process data analysis; management analyses
Data and integration
Process and production data recorded in the zenon platform.
AI functions
Not documented as a function in the sources consulted. This does not mean that no AI is offered.
Operating model
Clarify the operating model for the specific part of the offer.
Pricing basis
Ask the provider about the price and the modules included.
Check before selecting
How are data gaps and subsequent corrections shown when condensing?
COSMINO analyses operating data per workstation and presents OEE and loss times. In addition, the provider describes analyses of cycle data, quality and performance variances. A sensible test case is a short interruption in the cycle. It can be used to check how workstation status and the assigned loss type enter the report.
Assessment: Series manufacturers with detailed analysis of production losses.
Suitable tasks
Workstation OEE; loss time analysis; cycle data analysis
Data and integration
Operating data, machine status and assigned loss types.
AI functions
Not documented as a function in the sources consulted. This does not mean that no AI is offered.
Operating model
Clarify the operating model for the specific part of the offer.
Pricing basis
Ask the provider about the price and the modules included.
Check before selecting
Which short stops flow into the time losses and how are they reclassified afterwards?
Shiftconnector brings together information from the handover between shifts. For the production environment, the manufacturer describes an overview of quantities, measured values, plant states and incidents. Those responsible can view KPIs such as OEE or batch numbers from earlier shifts in connection with the staff's reports.
Assessment: Process plants with several shift teams and documented handover.
Evocon prepares production data as reports for manufacturing teams. Anyone who wants to continue analyses in an existing BI environment can check the documented reporting API. According to the provider, access to Advanced Analytics and this interface is tied to the Professional and Enterprise packages.
Assessment: Plant controllers with their own BI system and KPIs from the line.
Suitable tasks
Production reports; OEE analysis; data transfer to BI
Data and integration
Production data from Evocon, retrieval via reporting API depending on the package.
AI functions
Not documented as a function in the sources consulted. This does not mean that no AI is offered.
Operating model
Clarify the operating model for the specific part of the offer.
Pricing basis
Ask the provider about the price and the modules included.
Check before selecting
Which history, shift attributes and API endpoints are included in the offer?
Factbird combines KPIs and graphical elements in reusable production reports. Within Insights, personal analyses and company reports shared by site can be distinguished. For a fixed reporting round, scheduled dispatch as a PDF attachment is documented. This allows line managers to use a uniform structure for several shifts.
Assessment: Manufacturing companies with several lines or sites.
Suitable tasks
Line reports; plant comparison; PDF dispatch
Data and integration
Production KPIs and report elements from Factbird Insights.
AI functions
Not documented as a function in the sources consulted. This does not mean that no AI is offered.
Operating model
Clarify the operating model for the specific part of the offer.
Pricing basis
Ask the provider about the price and the modules included.
Check before selecting
Which site permissions apply to recipients of distributed PDF reports?
FASTEC's MES basic module contains a Report Designer for customised preparation of production data. The provider also describes printing and export options as well as resource master data. In a demonstration, it can be checked how a self-created analysis reacts to changes to a workstation or machine master record.
Assessment: Manufacturing plants with their own need for reports from the MES.
Suitable tasks
Custom manufacturing reports; resource analysis; export of production data
Data and integration
Production data and resource master data recorded in the FASTEC MES.
AI functions
Not documented as a function in the sources consulted. This does not mean that no AI is offered.
Operating model
Clarify the operating model for the specific part of the offer.
Pricing basis
Ask the provider about the price and the modules included.
Check before selecting
Can the specialist department extend a report itself and review the changes before approval?
gbo datacomp describes the calculation and display of production KPIs on shop-floor displays, at the workstation and on mobile devices. In addition to the current status, historical information is available. The offer is of particular interest when shift teams and production management access the same values and want to compare them for different periods.
Assessment: Manufacturing areas with KPI display at the workstation and on the shop floor.
Suitable tasks
Shop-floor KPIs; historical production analysis; mobile dashboards
Data and integration
Current and historical production data.
AI functions
Not documented as a function in the sources consulted. This does not mean that no AI is offered.
Operating model
Clarify the operating model for the specific part of the offer.
Pricing basis
Ask the provider about the price and the modules included.
Check before selecting
How quickly do late reports appear in the historical and in the current view?
Ignition's Reporting Module generates reports on a schedule on the gateway. For a report, several execution times as well as parameters and follow-up actions can be stored. For plants in different time zones, the local gateway time is relevant because it determines the time of the scheduled execution.
Assessment: Plant operators with an Ignition gateway and recurring report jobs.
Suitable tasks
Scheduled reports; parameterised shift reports
Data and integration
Data and parameters set up for the respective Ignition report.
AI functions
Not documented as a function in the sources consulted. This does not mean that no AI is offered.
Operating model
Execution of scheduled reports on the Ignition gateway.
Pricing basis
Ask the provider about the price and the modules included.
Check before selecting
What happens at a time change or if the gateway fails during shift handover?
Industrie Informatik positions the BI component of cronetwork for timely analyses of manufacturing data. User-specific analyses are intended to make the KPIs needed accessible to the respective responsible persons. For selection, it makes sense to compare the same order in production management and controlling, so that differing reference times are noticed early.
Assessment: Manufacturing companies with department-dependent KPI views.
Suitable tasks
Manufacturing KPIs; user-specific analyses
Data and integration
Manufacturing and process data available in cronetwork.
AI functions
Not documented as a function in the sources consulted. This does not mean that no AI is offered.
Operating model
Clarify the operating model for the specific part of the offer.
Pricing basis
Ask the provider about the price and the modules included.
Check before selecting
Can KPIs be traced from the condensed plant view to the originating order?
inray's FAS Web Reporting prepares process curves, KPIs and statistics from production sections. The manufacturer mentions applications in maintenance, energy management and traceability. For selection, what matters is which events and measured values can be related to the same lot or the same production section.
Assessment: Plants with different data sources within one manufacturing operation.
Suitable tasks
Process value reports; manufacturing statistics; lot-based analysis
Data and integration
Process values and KPIs of the production sections integrated.
AI functions
Not documented as a function in the sources consulted. This does not mean that no AI is offered.
Operating model
Clarify the operating model for the specific part of the offer.
Pricing basis
Ask the provider about the price and the modules included.
Check before selecting
How is the time window of a lot assigned to the measured values and events?
MachineMetrics provides reports on, for example, OEE, downtime and utilisation. In the Report Builder, users select KPIs, grouping and filters themselves. Comparisons between machines and shifts, CSV exports and recurring e-mails are documented. For comparing two machines, the plant should first fix the same definition of available time.
Assessment: Production managers with a regular need for machine comparisons.
Seeq Organizer condenses analyses from the Workbench into documents and dashboards. Content can be tied to a date or plant and updated continuously. A PDF version can be created for a shift or process report. Links back to the analysis remain usable for readers with the appropriate authorisation.
Assessment: Process engineers who share analysis results with operations.
Suitable tasks
Process reports; plant comparison; annotated time series
Data and integration
Workbench analyses with assigned periods and plants.
AI functions
Not documented as a function in the sources consulted. This does not mean that no AI is offered.
Operating model
Clarify the operating model for the specific part of the offer.
Pricing basis
Ask the provider about the price and the modules included.
Check before selecting
Should the approved PDF reflect a fixed data status or a link to the current view?
For its OEE module, Sepasoft describes two approaches to production. Running orders supply current information via Ignition tags. For retrospective analysis, production and downtime data are evaluated. This allows manufacturing teams to view the current status separately from the loss structure of earlier runs.
Assessment: Companies that integrate production analyses into an Ignition environment.
Suitable tasks
OEE trend; downtime causes; running orders
Data and integration
Current run data in Ignition tags and analysis values of the MES module.
AI functions
Not documented as a function in the sources consulted. This does not mean that no AI is offered.
Operating model
Clarify the operating model for the specific part of the offer.
Pricing basis
Ask the provider about the price and the modules included.
Check before selecting
Which downtime causes does the plant record and which does the staff add?
SmartSights offers XLReporter for the automated creation of industrial reports from plant data. The manufacturer's history attributes the earlier brand SyTech to the product. To compare several report variants, the plant should test a manual retrieval and the scheduled execution with the same plant state.
Assessment: Plant operators with regular reports from technical systems.
Suitable tasks
Plant reports; automated process documentation
Data and integration
Industrial data sources set up for XLReporter.
AI functions
Not documented as a function in the sources consulted. This does not mean that no AI is offered.
Operating model
Clarify the operating model for the specific part of the offer.
Pricing basis
Ask the provider about the price and the modules included.
Check before selecting
Which data source remains reachable during an interruption and how does the gap appear in the report?
SYMESTIC records OEE and other production KPIs in the cloud MES. The topics described include scrap and downtime. For assessing a line, it is expedient to trace the shares of availability, performance and quality separately on an example shift and to reconcile them with the staff's feedback.
Assessment: Series manufacturers in need of ongoing line KPIs.
Suitable tasks
OEE reports; scrap analysis; downtime overview
Data and integration
Production and machine data in the SYMESTIC MES.
AI functions
Not documented as a function in the sources consulted. This does not mean that no AI is offered.
Operating model
Cloud MES.
Pricing basis
Ask the provider about the price and the modules included.
Check before selecting
How does the calculation treat planned production breaks and scrap reported afterwards?
DashHub bundles trends and events from TrendMiner in operational overviews. The documented HTML export for context objects is suitable, for example, for a shift handover. It refers to the contents of the corresponding context tiles. For a complete report, it is worth reconciling the export contents with all displayed dashboard elements.
Assessment: Process engineering plants with events and time series.
Suitable tasks
Process events; shift handovers; trend overviews
Data and integration
TrendMiner views and context objects from dashboard tiles.
AI functions
Not documented as a function in the sources consulted. This does not mean that no AI is offered.
Operating model
Clarify the operating model for the specific part of the offer.
Pricing basis
Ask the provider about the price and the modules included.
Check before selecting
Which tiles belong to the shift handover and actually appear in the export?
For XL Enterprise, Vorne documents the scheduled dispatch of reports by work centre or higher-level organisational unit. Recipients select the report template and period. For shift comparison, what matters is whether the selection represents a single plant or already condenses several workstations.
Assessment: Production managers with recurring loss and performance reports.
Suitable tasks
Shift reports; OEE analyses; report dispatch
Data and integration
Production states and periods of the workstations set up in XL.
AI functions
Not documented as a function in the sources consulted. This does not mean that no AI is offered.
Operating model
Clarify the operating model for the specific part of the offer.
Pricing basis
Ask the provider about the price and the modules included.
Check before selecting
How does the production week begin for shifts that run past midnight?
Primary sources · checked on 31.10.2026 Configure XL
Exaquantum Report Manager prepares data from the Exaquantum Historian. According to the manufacturer, reports are created in Excel and run on request or periodically. Before a process report is handed over, it should be established which mean values or peak values are meaningful for the period under review.
Assessment: Process plants with Exaquantum and Excel report templates.
Suitable tasks
Process reports; periodic plant reports; historian analysis
Data and integration
Time series in the Exaquantum Historian.
AI functions
Not documented as a function in the sources consulted. This does not mean that no AI is offered.
Operating model
Clarify the operating model for the specific part of the offer.
Pricing basis
Ask the provider about the price and the modules included.
Check before selecting
How are gaps in a measurement series treated during condensing?