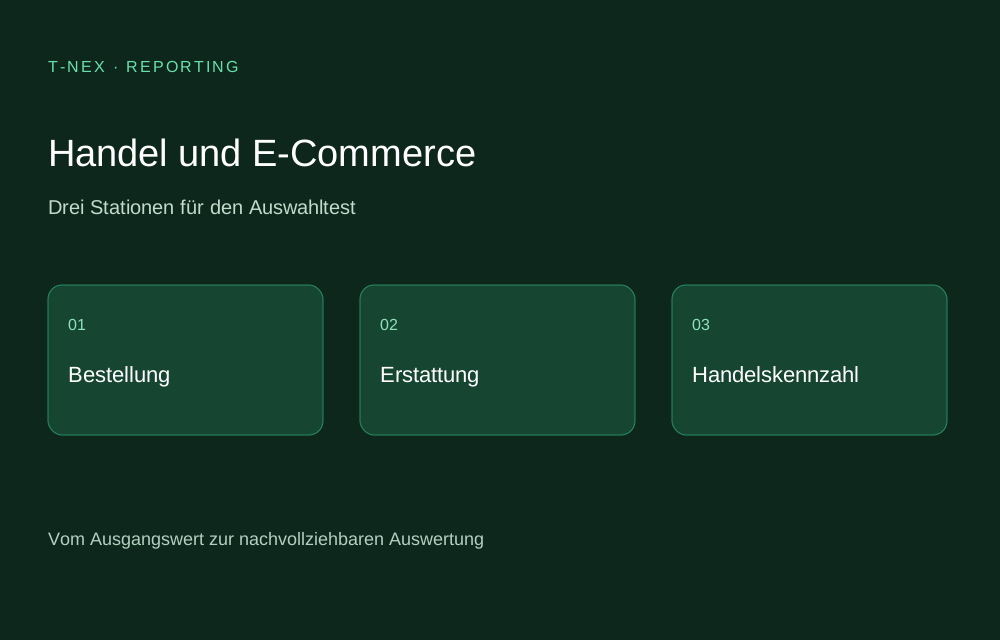
E-commerce reporting for shop operators and retail companies
For the shop management, what counts is what is left of an order after discount, shipping and return. An order with a later refund shows whether the margin reported can also be explained across month boundaries.
14 specialist profiles and the complementary offer from T-NEX
15 of 15 entries
Publisher's offer first · Other entries alphabetical
T-NEX
Publisher’s own offer
Dynamic AI Reporting · Custom analysis
For a shop, margin by product group would be a possible T-NEX pilot. This requires approved order, cost and returns data with a common order reference.
Example question In which month should a subsequent refund change the margin?
42Signals analyses the visibility and availability of products on digital marketplaces. The product demos show dashboards for prices, stock availability and search presence. This addresses retail questions that can hardly be explained from internal revenue data alone.
Assessment: Brands and retailers that monitor their online range in the market.
Suitable tasks
Price monitoring; range availability; search presence
Data and integration
Observed marketplace offers, prices, availability and search positions
AI functions
Not documented as a function in the sources consulted. This does not mean that no AI is offered.
Operating model
Check the operating model and data location in the offer.
Pricing basis
Clarify the price and required modules with the provider.
Check before selecting
Test marketplace coverage and the matching of identical items across several providers.
Lifetimely looks at customers by cohort. In the LTV report, the retailer examines what revenue newly acquired customers contribute later and how the acquisition costs reported are calculated. This creates a different basis for comparison than looking at individual orders.
Assessment: Retailers who examine repeat purchases and the profitability of customer acquisition.
BeProfit starts at the level of an individual order. The analysis shows which orders contribute more or less profit after the costs taken into account. Retailers can thus select conspicuous orders and check the underlying calculation.
Assessment: Online retailers with widely differing costs per order.
Suitable tasks
Order profitability; cost analysis
Data and integration
Revenue and allocated costs of the orders
AI functions
Not documented as a function in the sources consulted. This does not mean that no AI is offered.
Operating model
Check the operating model and data location in the offer.
Pricing basis
Clarify the price and required modules with the provider.
Check before selecting
Reconcile shipping, payment fees and subsequent charges on an order that has actually been completed.
Conjura sets shop, marketing and web analytics data side by side in an overall view updated daily. The analysis links channel performance, return on advertising and customer acquisition costs. A sensible selection test is to compare the sales booked in the shop with the advertising attribution for the same period.
Assessment: Heads of e-commerce and marketing teams.
Suitable tasks
E-commerce performance; acquisition costs
Data and integration
Storefront, advertising platforms and web analytics
AI functions
Not documented as a function in the sources consulted. This does not mean that no AI is offered.
Operating model
Check the operating model and data location in the offer.
Pricing basis
Clarify the price and required modules with the provider.
Check before selecting
Clarify, in the example, the day boundary, the currency and the attribution of a purchase to several touchpoints.
Daasity provides preconfigured report templates on a unified data model or for individual data sources. Areas for e-commerce, marketing and retail combine clear KPIs with more in-depth analyses. This is suitable for comparing recurring questions from several sales channels.
Assessment: Retail companies with direct sales and several report recipients.
DataHawk documents a Power BI template for Amazon sellers. The analysis accesses data provided via Snowflake and enables the comparison of sales and advertising KPIs. Individual KPI combinations can be exported for further work.
Assessment: Marketplace retailers who need repeatable Amazon analyses.
Suitable tasks
Marketplace reporting; ad analysis; KPI export
Data and integration
Amazon sales data and Amazon Ads via the documented data connection
AI functions
Not documented as a function in the sources consulted. This does not mean that no AI is offered.
Operating model
Check the operating model and data location in the offer.
Pricing basis
Clarify the price and required modules with the provider.
Check before selecting
Record the costs and responsibilities for DataHawk, data platform and Power BI separately.
Glew combines retail and marketing KPIs such as order value, revenue and advertising spend in dashboards. Prefabricated analyses are supplemented by filters and a report designer. A retailer can thus first use a standard view and later compare its own product groups.
Assessment: Retailers with several data sources and a further need for their own analyses.
Suitable tasks
Order value analysis; revenue and profit; advertising efficiency
Data and integration
Connected e-commerce and marketing data
AI functions
Not documented as a function in the sources consulted. This does not mean that no AI is offered.
Operating model
Check the operating model and data location in the offer.
Pricing basis
Clarify the price and required modules with the provider.
Check before selecting
For margin analyses, check which item costs and refunds are taken into account.
Metorik analyses orders from WooCommerce and Shopify. Which order statuses are included in a report affects the figures. The documentation explains the treatment of cancellations and refunds. This makes a comparison with your own month-end close particularly informative.
Assessment: Shops that want to reconcile net revenue and order statuses in a traceable way.
Suitable tasks
Shop revenue; order status; refunds
Data and integration
Order and refund data in WooCommerce or Shopify
AI functions
Not documented as a function in the sources consulted. This does not mean that no AI is offered.
Operating model
Check the operating model and data location in the offer.
Pricing basis
Clarify the price and required modules with the provider.
Check before selecting
Test cancelled, partially refunded and completed orders in the same period.
minubo links data preparation with dashboards and analysis for online retail. Custom filters, period comparisons and Plan/Actual comparisons can be combined with product and customer segments. For selection, a business transaction that brings together shop data and commercial costs is a good choice.
Assessment: Retailers with cross-channel management and their own segments.
Northbeam classifies advertising performance by channel, campaign, ad group and ad. In the Sales Attribution Dashboard, users can compare the development of various KPIs over time and the contribution of individual channels. The choice depends on the attribution model used and on the shop's business model.
Assessment: E-commerce teams that distribute budgets between advertising channels.
Suitable tasks
Marketing attribution; campaign comparison
Data and integration
Campaign and sales data of the connected channels
AI functions
Not documented as a function in the sources consulted. This does not mean that no AI is offered.
Operating model
Check the operating model and data location in the offer.
Pricing basis
Clarify the price and required modules with the provider.
Check before selecting
Have the observation period, the attribution model and the differences from the accounting revenue disclosed.
In PlentyONE, users select configured KPIs and periods for their own dashboard views. Detail views allow the jump from an overview to further displays. Those responsible can thus check operational KPIs in the retail environment they use.
Assessment: Retail businesses whose operational data is maintained in PlentyONE.
Suitable tasks
Retail KPIs; dashboard detail views
Data and integration
KPIs configured in plentyBI and data from PlentyONE
AI functions
Not documented as a function in the sources consulted. This does not mean that no AI is offered.
Operating model
Check the operating model and data location in the offer.
Pricing basis
Clarify the price and required modules with the provider.
Check before selecting
Document the KPI configuration, filters and required access rights before the monthly comparison.
Polar consolidates connected shop and marketing data for custom reports. A formula editor makes it possible to calculate custom metrics such as profit or profit in relation to advertising spend. Retailers can thus reproduce their recurring Excel analysis using defined KPIs.
Assessment: Online retailers with their own requirements for margin and marketing efficiency.
Suitable tasks
E-commerce reports; custom profit KPIs
Data and integration
E-commerce and marketing sources connected in Polar
AI functions
Not documented as a function in the sources consulted. This does not mean that no AI is offered.
Operating model
Check the operating model and data location in the offer.
Pricing basis
Clarify the price and required modules with the provider.
Check before selecting
Test a custom profit formula with a completed month and the associated cost items.
sellerboard provides reports by day or month for Amazon sellers. In addition to revenue and advertising, refunds, fees, product costs and profit, among others, are shown. This allows variances in the monthly value to be examined by individual item or return.
Assessment: Amazon retailers and their commercial managers.
Shopware offers dashboards for key retail KPIs in its own shop system. The analysis can serve as a starting point if the data needed is already in the shop. For further processing, Shopware describes the export of data, for example for analysis in Excel.
Assessment: Shops that want to use their existing Shopware system for reports.
Suitable tasks
Shop KPIs; dashboard analysis; export
Data and integration
Data of the Shopware online shop
AI functions
Not documented as a function in the sources consulted. This does not mean that no AI is offered.
Operating model
Check the operating model and data location in the offer.
Pricing basis
Clarify the price and required modules with the provider.
Check before selecting
Check the shop version, data scope and availability of the module for the installation in use.