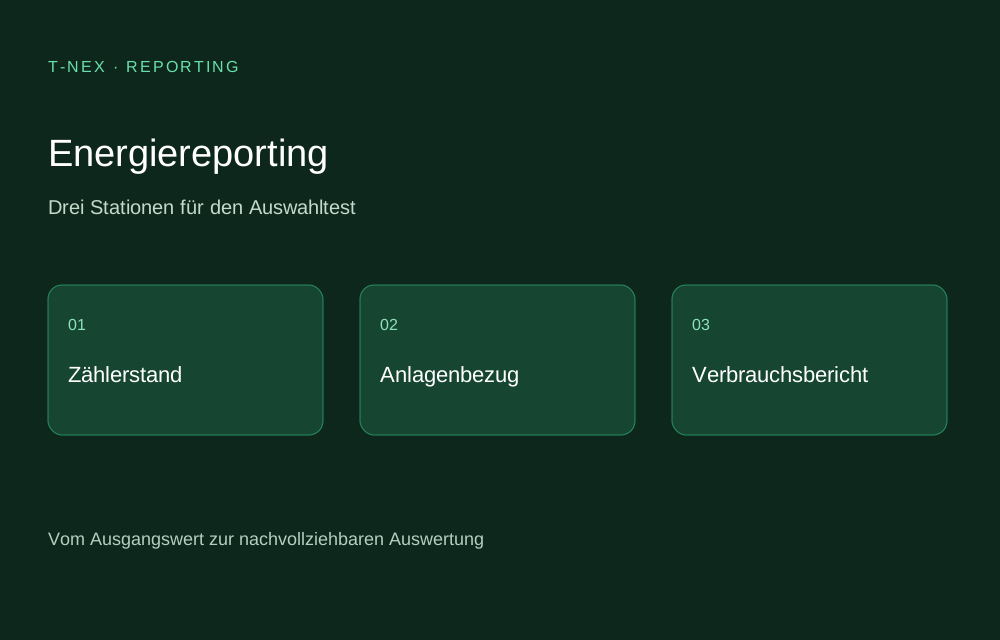
For energy management, higher electricity consumption is only meaningful once production volume and operating time are known. Compare two shifts and trace the values back to the corresponding meter.
17 specialist profiles and the supplementary offer from T-NEX
18 of 18 entries
Publisher's offer first · Other entries alphabetical
T-NEX
Publisher’s own offer
Dynamic AI Reporting · Custom analysis
For an energy report, T-NEX could compare consumption volumes by asset and shift. This would require correctly assigned meter readings and production volumes.
Example question How does consumption per unit produced change during longer standstills?
The Watching edition of ABB Ability Energy Manager makes historical and current energy data of assets visible. The comparison of measured consumption with target values is aimed at technical operations management. It becomes meaningful when the chosen target value matches operating time or utilisation.
Assessment: Technical operations management with defined consumption targets.
Suitable tasks
Consumption comparison; Asset overview; Target value control
Data and integration
Energy data of the connected devices and assets.
AI functions
Not documented as a function in the sources consulted. This does not mean that no AI is offered.
Operating model
Clarify the operating model for the specific part of the offer.
Pricing basis
Ask the provider about the price and the modules included.
Check before selecting
Who maintains the target values when utilisation changes?
Flexreports generates recurring energy reports from Efficio. A report can relate to the entire company structure or to a single measuring point. The add-on module supports monthly and annual comparisons. For shared consumers such as a compressed-air system, the allocation key across the areas supplied should remain traceable.
Assessment: Energy managers with regular distribution of area reports.
Suitable tasks
Monthly energy reports; Prior-year comparison; Costs per area
Data and integration
Measuring points and organisational assignments from Efficio.
AI functions
Not documented as a function in the sources consulted. This does not mean that no AI is offered.
Operating model
Clarify the operating model for the specific part of the offer.
Pricing basis
Ask the provider about the price and the modules included.
Check before selecting
How is a shared consumer allocated across the areas?
Eniscope links on-site energy recording with cloud-based analysis. The manufacturer mentions the examination of individual assets and entire buildings as well as automatic distribution of reports. One use case is the comparison between measured asset consumption and operational usage times.
Assessment: Operations that need data below the main meter.
Suitable tasks
Energy per asset; Building overviews; Report distribution
Data and integration
Energy data from the Eniscope measurement and gateway infrastructure.
AI functions
Not documented as a function in the sources consulted. This does not mean that no AI is offered.
Operating model
Cloud platform with on-site recording.
Pricing basis
Ask the provider about the price and the modules included.
Check before selecting
Which measuring points are required for a reliable separation of consumers?
deZemReport is the reporting module of the deZem DataSuite. It compiles configurable energy and environmental reports and sends them regularly by e-mail. For distributed operating areas, the structure can be adapted to the recipients. A month-end with late meter readings is a sensible test for regular operation.
Assessment: Companies with recurring energy and environmental reports.
Suitable tasks
Energy reports; IoT KPIs; Report distribution
Data and integration
IoT and consumption data of the deZem DataSuite.
AI functions
Not documented as a function in the sources consulted. This does not mean that no AI is offered.
Operating model
Clarify the operating model for the specific part of the offer.
Pricing basis
Ask the provider about the price and the modules included.
Check before selecting
How do values received later appear in a report that has already been distributed?
econ4 analyses energy flows and presents them in management and specialist reports. The product documentation mentions ABC analyses for main consumers, spectral analyses for peak load times and Sankey diagrams for energy flows. This makes it possible to distinguish questions about the largest consumer from questions about the time of the load peak.
Assessment: Plants with several consumption groups and load peaks.
Suitable tasks
ABC consumption analysis; Peak load report; Energy flow diagram
Data and integration
Energy and consumption data from the connected measurement sources.
AI functions
Not documented as a function in the sources consulted. This does not mean that no AI is offered.
Operating model
Clarify the operating model for the specific part of the offer.
Pricing basis
Ask the provider about the price and the modules included.
Check before selecting
Do the measurement interval and time reference match the load peak relevant for billing?
Energy Brain manages data on electrical energy and other media such as gas, water, steam and compressed air. The software provides current measured values, historical trends and reports. This makes it possible to look at several media for the same production period, provided that measurement intervals and units are defined consistently.
Assessment: Operations with several types of energy and media.
Suitable tasks
Media consumption; Energy reports; Process parameters
Data and integration
Measured values on consumption, generation, environmental and process parameters.
AI functions
Not documented as a function in the sources consulted. This does not mean that no AI is offered.
Operating model
Clarify the operating model for the specific part of the offer.
Pricing basis
Ask the provider about the price and the modules included.
Check before selecting
How are gaps in measured values and different physical units shown?
Enectiva calculates consumption and cost statistics from meter data. Graphical reports are accessed via an object structure. Configuration depends on the role. With several buildings, it should be settled who only reads the reports and who may change their composition for the other recipients.
Assessment: Companies with distributed properties and central energy reporting.
Suitable tasks
Meter statistics; Consumption report; Energy cost comparison
Data and integration
Energy meters and other time series in Enectiva.
AI functions
Not documented as a function in the sources consulted. This does not mean that no AI is offered.
Operating model
SaaS application.
Pricing basis
Ask the provider about the price and the modules included.
Check before selecting
Which historical costs change when tariffs are corrected retrospectively?
Energis.Cloud shows energy KPIs in tables, charts and dashboards. Personalised PDF reports can be created and distributed automatically. In this way, a detailed technical analysis for the energy manager and a condensed version for site management can be based on the same measurement period.
Assessment: Energy managers and service providers with different report recipients.
Suitable tasks
Energy KPIs; Automatic PDF reports; Site dashboard
Data and integration
Energy and performance data recorded on the platform.
AI functions
Not documented as a function in the sources consulted. This does not mean that no AI is offered.
Operating model
Clarify the operating model for the specific part of the offer.
Pricing basis
Ask the provider about the price and the modules included.
Check before selecting
How are the reporting period and measurement data status determined for each recipient?
EnergyCAP starts from utility bills. Users can configure and automate analyses and charts for invoice data. This makes it possible to compare costs and consumption across several supply points. Anyone who wants to investigate short-term machine events additionally needs measurement data with a finer time resolution.
Assessment: Companies with several supply points and central energy controlling.
Suitable tasks
Utility bills; Site costs; Consumption dashboards
Data and integration
Utility bills and associated consumption and cost data.
AI functions
Not documented as a function in the sources consulted. This does not mean that no AI is offered.
Operating model
Clarify the operating model for the specific part of the offer.
Pricing basis
Ask the provider about the price and the modules included.
Check before selecting
How does the system handle invoice corrections and differing billing periods?
EnergyElephant organises utility data by consumption, costs and environmental impact. Reports and dashboards give an overview of the sites recorded. For management, the origin of the environmental factors used should be as traceable as that of the measured consumption.
Assessment: Cross-site energy management and energy service providers.
Suitable tasks
Energy portfolio reports; Cost comparisons; Environmental KPIs
Data and integration
Utility, consumption and environmental data of the sites.
AI functions
Not documented as a function in the sources consulted. This does not mean that no AI is offered.
Operating model
Clarify the operating model for the specific part of the offer.
Pricing basis
Ask the provider about the price and the modules included.
Check before selecting
Which factors underlie the respective environmental indicator?
Guidewheel brings together runtime, OEE and other production data in the FactoryOps Hub. The analysis can be related to machines, shifts and plants. A separate area of application links energy consumption and costs with asset performance, for example as a basis for considering cost per unit.
Assessment: Plants that consider energy input and asset performance together.
Suitable tasks
Runtime comparison; Energy per machine; Plant KPIs
Data and integration
Runtimes, energy data and, depending on the equipment, additional sensor values.
AI functions
Not documented as a function in the sources consulted. This does not mean that no AI is offered.
Operating model
Clarify the operating model for the specific part of the offer.
Pricing basis
Ask the provider about the price and the modules included.
Check before selecting
How are unit quantities and tariffs recorded for the calculation per unit?
InterWatt creates reports on energy, climate and environmental data. For energy controlling, IngSoft describes performance indicators and the investigation of several influencing factors using regression. A site comparison should specify whether absolute consumption or values adjusted for reference variables are reported.
Assessment: Energy management with several sites or varying utilisation.
Suitable tasks
Energy report; Performance indicators; Environmental reports
Data and integration
Measurement and reference data from energy controlling.
AI functions
Not documented as a function in the sources consulted. This does not mean that no AI is offered.
Operating model
Clarify the operating model for the specific part of the offer.
Pricing basis
Ask the provider about the price and the modules included.
Check before selecting
Are influencing variables and consumption data available at the same time resolution?
GridVis-Web includes management of reports and data exports from connected projects. Measured values and energy data can additionally be shown in dashboards. For operators of several measurement projects, it is relevant which analyses are available centrally and which have to be exported separately for onward sharing.
Assessment: Electrical engineering and energy management with several measuring point projects.
Suitable tasks
Energy reports; Report management; Measurement data dashboards
Data and integration
Energy and measurement data of the GridVis projects that have been set up.
AI functions
Not documented as a function in the sources consulted. This does not mean that no AI is offered.
Operating model
Clarify the operating model for the specific part of the offer.
Pricing basis
Ask the provider about the price and the modules included.
Check before selecting
Which functions does the intended GridVis edition include?
visual energy from KBR prepares energy data for operational analyses. KPIs can take production data into account. For the comparison of two assets, it is essential whether a report shows absolute consumption or consumption per production unit. Both figures answer different operational questions.
Assessment: Manufacturing companies with KPIs per area.
Suitable tasks
Energy KPIs; Consumption analysis; Production-related energy data
Data and integration
Measurement and production data of the KPIs that have been set up.
AI functions
Not documented as a function in the sources consulted. This does not mean that no AI is offered.
Operating model
Clarify the operating model for the specific part of the offer.
Pricing basis
Ask the provider about the price and the modules included.
Check before selecting
How are product changes and unit quantities taken into account in the comparison basis?
Phoenix Contact also offers its Energy Management Service for local operation. The product family supports monitoring and analysis of energy data. When selecting, the required meter types and the handover to commercial analysis should be considered together.
Assessment: Industrial companies with requirements for local operation.
Suitable tasks
Local energy monitoring; Consumption analysis
Data and integration
Data of the measuring devices intended for the service.
AI functions
Not documented as a function in the sources consulted. This does not mean that no AI is offered.
Operating model
Local operation in the edition described here.
Pricing basis
Ask the provider about the price and the modules included.
Check before selecting
How are sub-meters assigned to the plant's cost centres?
Spacewell Energy presents energy performance indicators in customisable dashboards and reports. The analysis can cover several sites and the review of measures carried out. For the assessment, consumption and reference variable, such as floor area or usage time, should be considered together.
Assessment: Operators of several buildings and technical facilities.
Suitable tasks
Energy portfolio; Site comparison; Measures evaluation
Data and integration
Consumption data and reference variables of the sites recorded.
AI functions
Not documented as a function in the sources consulted. This does not mean that no AI is offered.
Operating model
Clarify the operating model for the specific part of the offer.
Pricing basis
Ask the provider about the price and the modules included.
Check before selecting
Which reference variables can be stored for sites that are used differently?
The Monitoring Solution from WAGO visualises energy data and other industrial parameters. The solution includes measuring devices and controllers. Stored data can be passed on to other systems. A plant can thus make measured values below the main meter usable for its own operating reports.
Assessment: Operations with their own measurement infrastructure and consumption overviews.
Suitable tasks
Energy monitoring; Consumer overview; Data handover
Data and integration
Measured values of the connected devices and controllers.
AI functions
Not documented as a function in the sources consulted. This does not mean that no AI is offered.
Operating model
Clarify the operating model for the specific part of the offer.
Pricing basis
Ask the provider about the price and the modules included.
Check before selecting
At what time resolution is the data available on export?